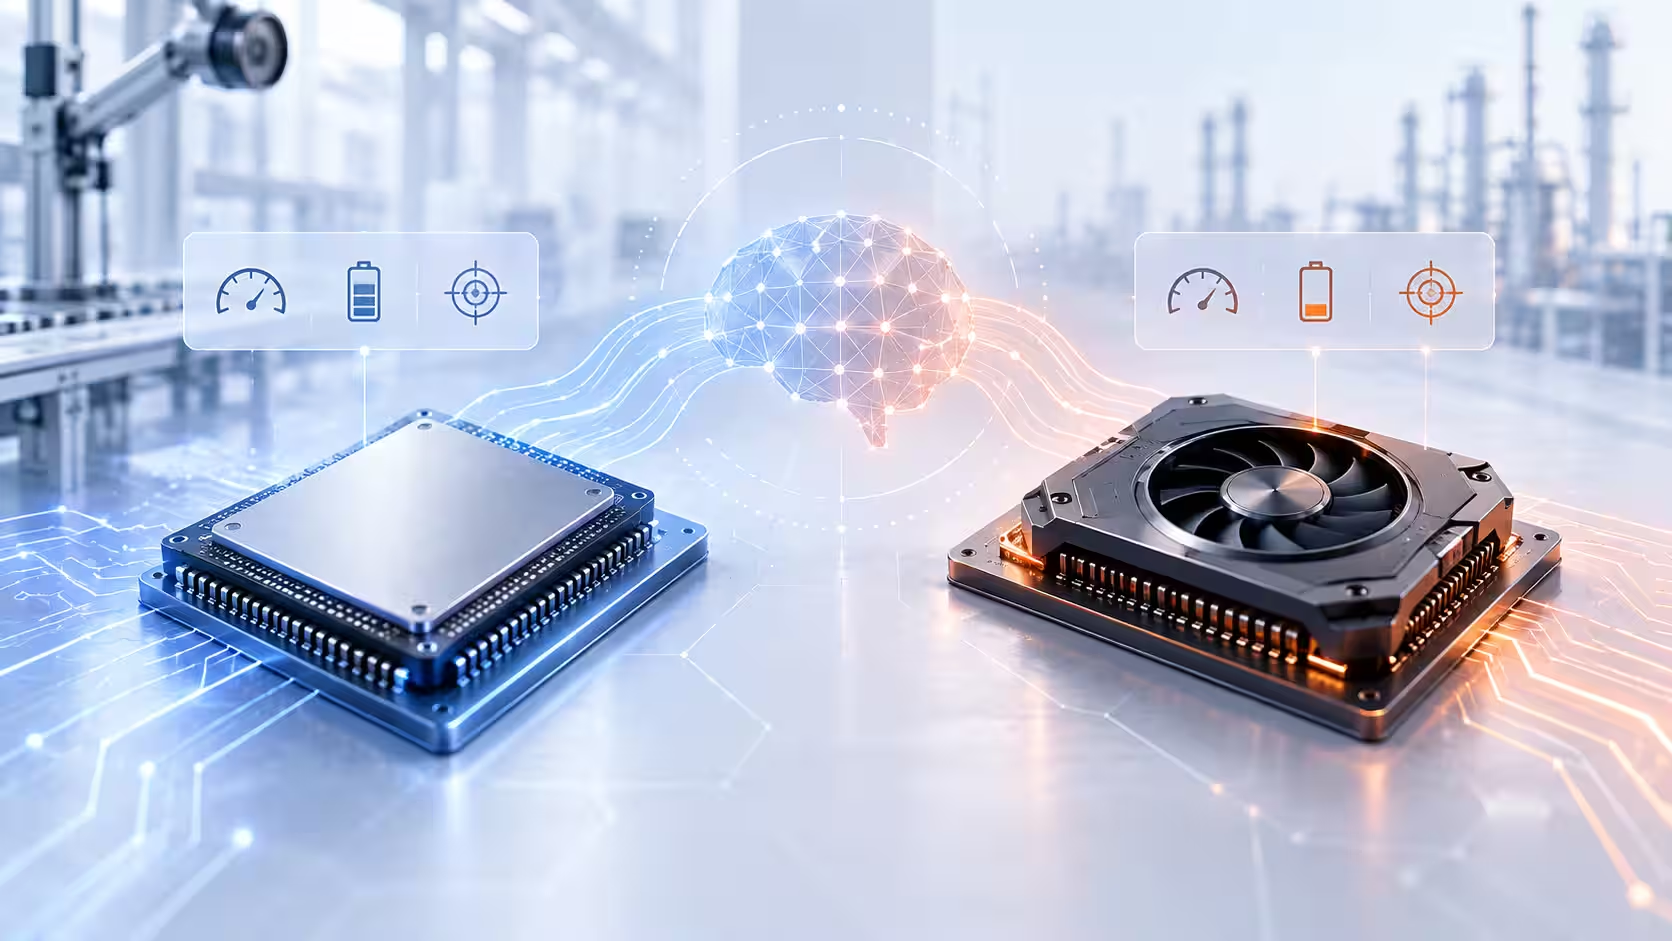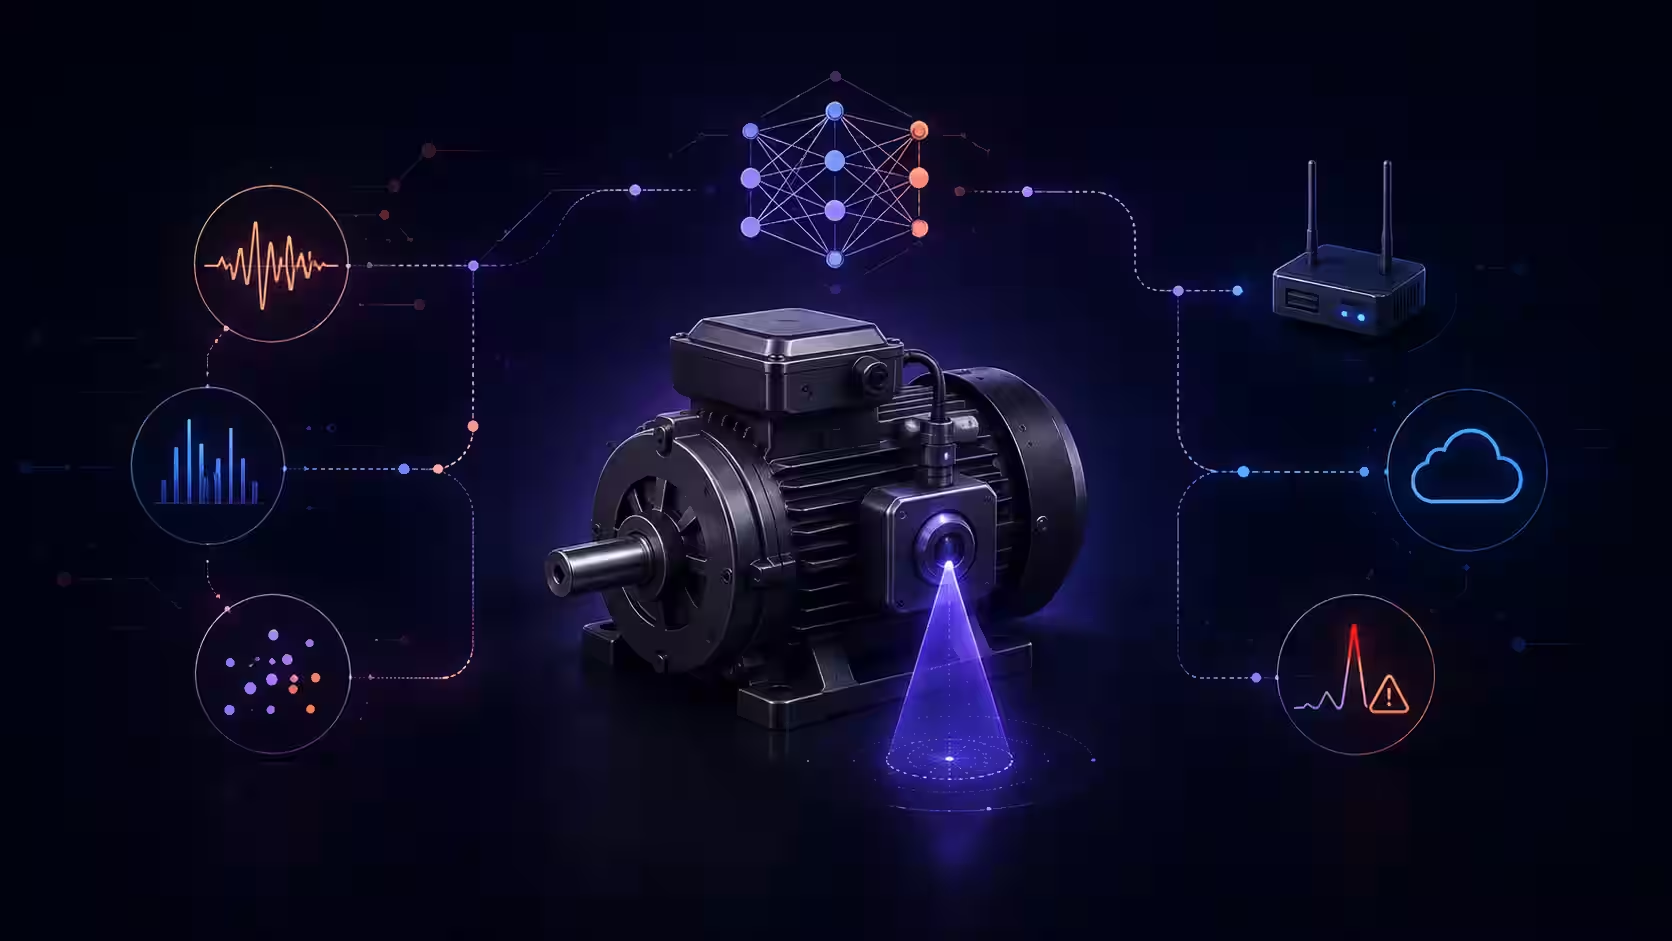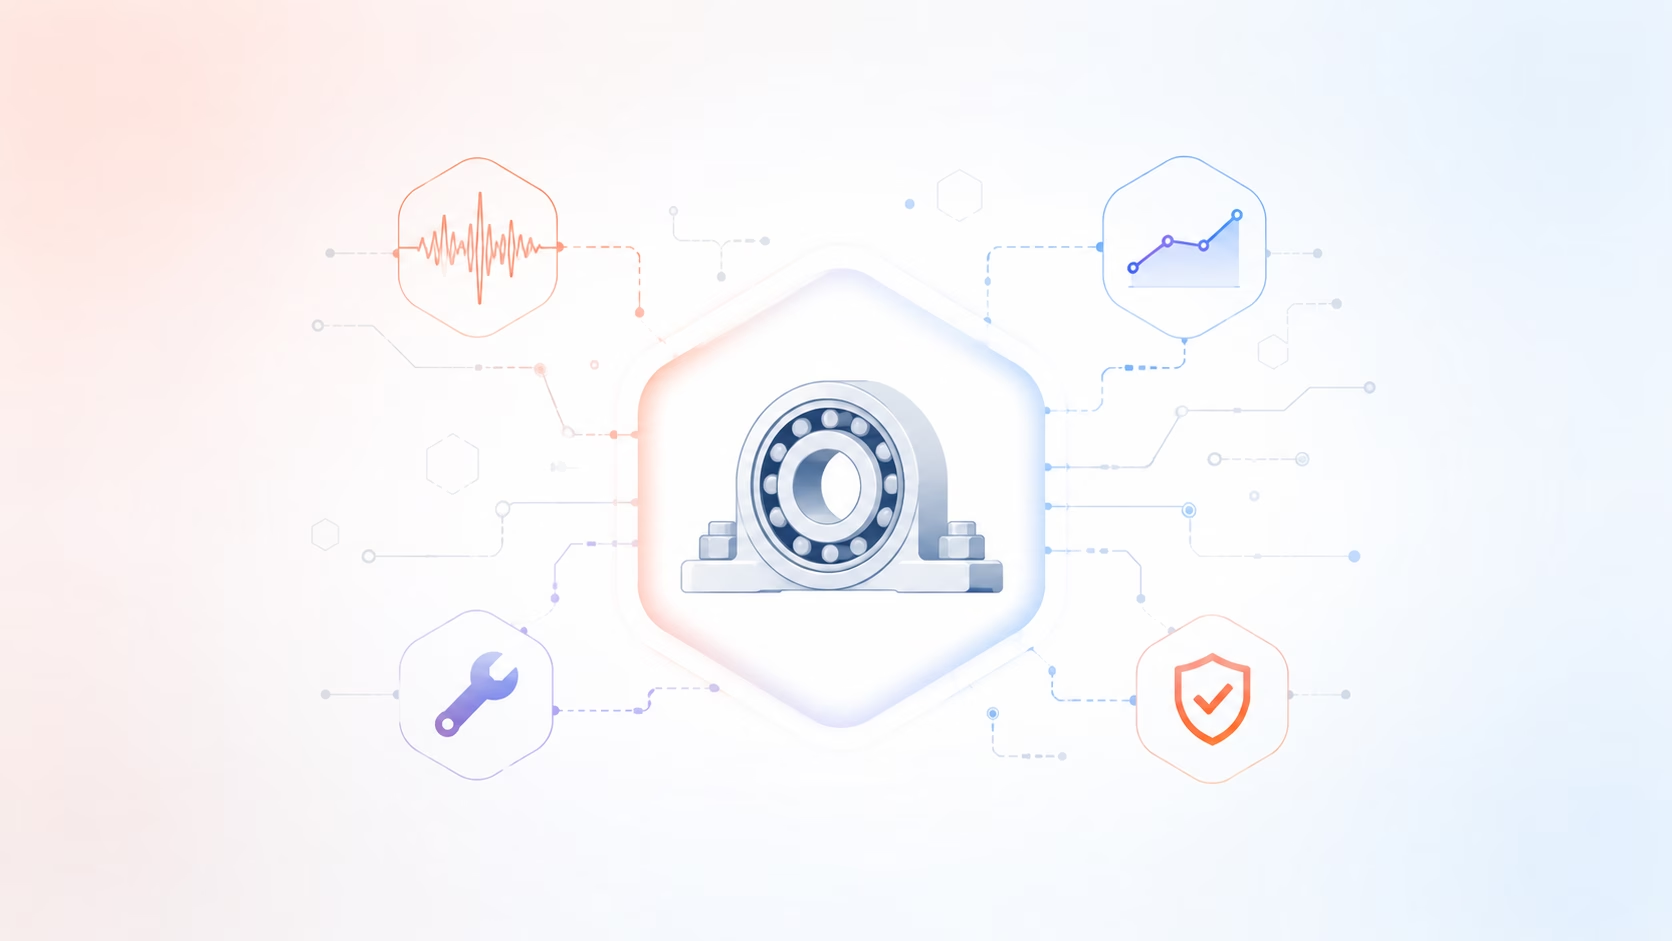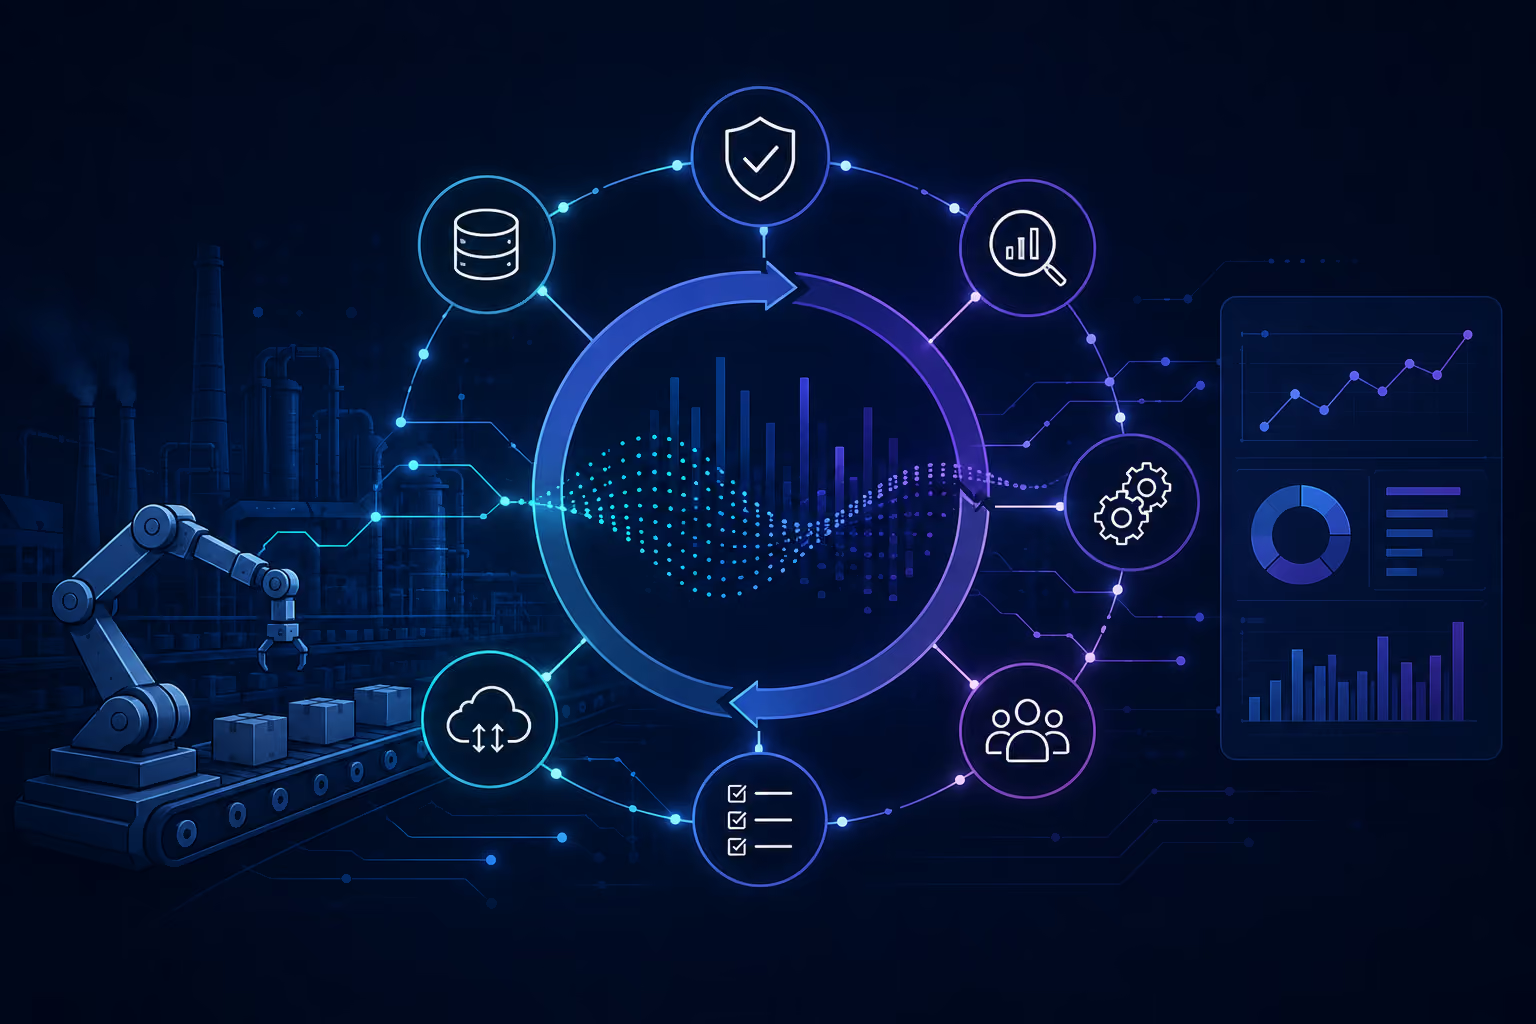
Industrial DataOps is a methodology for managing data in motion across an industrial environment, uniting OT, IT, and ET data and delivering it in context to decisions. The emphasis is on practice on the factory floor, not on the whiteboard: how data actually moves from a vibration sensor to a predictive maintenance alert, what breaks along the way, and what operational disciplines keep it working. This guide covers the core capabilities, architecture patterns, and deployment steps that make Industrial DataOps work in a real plant.
Key Takeaways
Industrial DataOps focuses on data in motion: the continuous stream of operational data flowing from field devices through OT systems and across the OT/IT boundary to analytics applications and back. Where classic enterprise DataOps is primarily concerned with data at rest, transforming and governing datasets already in a data warehouse or lake, Industrial DataOps is primarily concerned with data in motion: the pipeline from sensor to decision, operating continuously, with latency and reliability requirements that a batch-oriented enterprise data practice never encounters.
Industrial DataOps integrates IT, OT, and ET (engineering technology, including CAD models, simulation data, and engineering records) data types into a unified operational view. It is built on DevOps, Agile, and Lean principles adapted to the chaotic nature of the manufacturing floor: incomplete documentation, heterogeneous equipment vintages, protocols that predate the internet, and operational teams whose first priority is keeping production running. Where a software DataOps team can deploy a pipeline change in minutes with no risk to physical safety, an industrial DataOps team operates in an environment where a misconfigured gateway tag can propagate incorrect setpoints to a control system.
Industrial DataOps enables systems to communicate effectively by bridging the data gap between IT systems (business applications, cloud analytics, enterprise data platforms) and OT data (sensor readings, control system events, process historian archives). For the broader OT/IT integration context in which Industrial DataOps operates, see OT/IT integration.
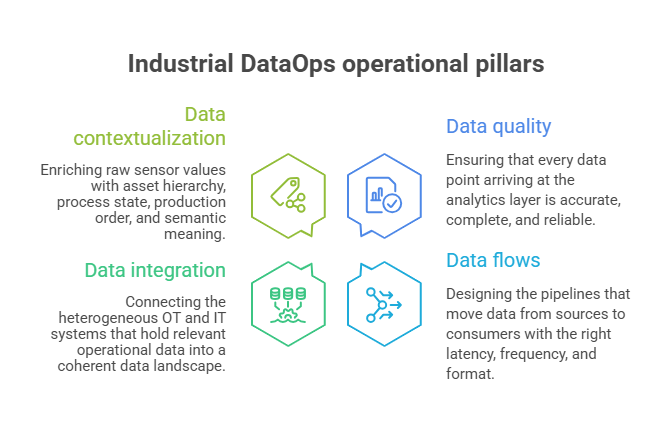
Industrial DataOps rests on four operational pillars that determine whether the data reaching decisions is trustworthy and useful:
Data quality: ensuring that every data point arriving at the analytics layer is accurate, complete, and reliable.
Data flows: designing the pipelines that move data from sources to consumers with the right latency, frequency, and format for each use case.
Data integration and sources: connecting the heterogeneous OT and IT systems that hold relevant operational data into a coherent data landscape.
Data contextualization: enriching raw sensor values with the asset hierarchy, process state, production order, and semantic meaning that make them useful to analytics and business systems.
Industrial DataOps streamlines data collection and transformation and creates a centralized, contextualized source of truth for decisions. Without it, operational data is typically scattered across siloed historians, SCADA databases, manual spreadsheets, and disconnected point-solutions, each with different schemas, different timestamps, and no shared understanding of what any data item means.
Data quality issues in industrial environments are often discovered only at the cloud or analysis layer, when a data scientist notices that a temperature historian has 40% null values, or when a predictive maintenance model starts generating nonsensical predictions. By then, the bad data has already propagated through multiple pipeline stages and corrupted downstream outputs.
The Industrial DataOps principle is to check quality as close to the data source as possible: at the edge device or gateway, before data leaves the production network. Edge devices can apply local quality rules that reject or flag out-of-range values, stuck signals (a sensor reporting the same value for an improbably long period, often indicating a communication fault rather than a stable process), and timestamp anomalies (values arriving with future timestamps or with gaps that exceed the expected reporting interval).
Data quality for industrial environments is measured by three dimensions:
Accuracy: does the value reflect the physical reality it purports to measure? A stuck signal reads a plausible value but does not reflect the process; a correctly functioning sensor provides an accurate measurement of the actual physical variable.
Completeness: are all expected data points present? A historian with 40% null values for a critical process variable is not a complete record, and any analytics built on it will reflect that incompleteness in their outputs.
Reliability: does the data arrive consistently, with the expected frequency and the expected timestamp relationship to the physical event it records? Highly variable latency between the physical event and the data record degrades the usefulness of time-series analysis.
Cleaning data at the edge and applying validation rules before data leaves the production network catches quality issues when correction is still possible, before they propagate to systems where remediation is expensive or impossible.
Industrial environments produce three distinct categories of data flows that require different pipeline designs:
Real-time data flows carry time-sensitive process values, alarm events, and control feedback at the speed the physical process requires. A vibration reading that informs a real-time anomaly detection model must arrive within seconds of the physical event. Real-time data processing at this level requires low-latency protocols (OPC UA or MQTT) and edge processing that does not introduce buffering delays. For the protocol choice, see OPC UA vs MQTT.
Batch data flows carry historical data, periodic reports, and scheduled analytics inputs at a latency that is measured in minutes to hours rather than milliseconds. A production order completion record that flows to ERP at shift end is a batch flow; the exact latency between event and ERP update is less critical than for a real-time control feedback signal.
Event-based data flows carry discrete state-change events (machine start, alarm activation, quality hold, batch completion) that have specific business meaning beyond the raw time-series value. Event-based flows require exactly-once delivery guarantees and event ordering that best-effort time-series flows do not.
Data conditioning ensures the correct format and frequency of data at each pipeline stage: standardizing engineering units (Celsius from one sensor, Fahrenheit from another, normalized to Kelvin for the analytics model), aligning time intervals (sensors reporting at 100ms and 1s intervals, aggregated to a 1-minute average for the OEE dashboard), and transforming data into the schema the consuming system expects. Message brokers (MQTT is the de facto standard for IIoT messaging) provide the publish-subscribe fan-out that decouples data producers from data consumers in real-time data flows. Where conditioning and the MQTT broker sit relative to edge gateways and cloud platforms is a layering question answered by the wider industrial IoT architecture.
An industrial estate has data sources that no single pipeline design handles uniformly. Operational systems include PLCs that speak Modbus RTU, SCADA historians with proprietary APIs, MES databases with SQL interfaces, ERP systems with REST APIs, and quality instruments with vendor-specific protocols. The data integration challenge is connecting this heterogeneous landscape into a unified data flow without requiring custom point-to-point code for every integration pair.
Industrial DataOps bridges the IT and OT data gap through a structured approach to integration: inventory the sources, classify by protocol and schema, select connectors that handle the specific protocols in the estate (industrial-grade OPC UA connectors for modern controllers, Modbus TCP and RTU drivers for legacy PLCs, REST API connectors for MES and ERP), and funnel all sources through the integration layer before they reach the analytics consumers.
Proprietary protocols require specialized connectors that most generic integration platforms do not include out of the box. Investing in proven industrial middleware (Kepware, HighByte, Ignition, or similar) for the legacy and proprietary protocol connections reduces custom integration code maintenance burden compared to writing connectors from scratch. Industrial DataOps supports bidirectional data flow: not just from OT to IT (sensor data to analytics) but from IT to OT (setpoints from optimization models back to controllers, production parameters from ERP to SCADA). Designing for bidirectional flow from the start avoids the architectural rework that single-direction designs require when the first closed-loop use case arrives.
Raw data from a sensor is not inherently useful to an analytics system or a business decision. A value of 187.3 tells a data scientist nothing without the context: Celsius, from the inlet temperature sensor, on extruder line 3, during production order 4872, producing product variant A, at 14:23:07 on November 3rd. Industrial DataOps adds this crucial context to raw data through semantic modeling, asset hierarchy, and process context attachment.
Asset hierarchy. Attach every data tag to a position in the asset hierarchy: site, area, line, machine, component, sensor. This hierarchy enables queries like "show me all temperature readings from line 3 during the last shift" rather than requiring the analyst to know the specific tag name for every sensor on that line.
Process context. Link each data record to the production state at the time it was recorded: which product was running, which production order, which shift, which operator. This contextualization is what enables cause-and-effect analysis of process data: not just "what was the temperature" but "what was the temperature during production of this specific product, on this specific order, and how did it correlate with the quality outcome."
Industrial data is often unstructured and requires contextualization to be useful: a historian with millions of time-stamped numeric values and no semantic labeling is a data swamp, not a data asset. Contextualization improves interpretation and usability across systems by making data self-describing: any system that consumes a contextualized data point can determine what it represents without consulting external documentation. Contextualized data links data sources for easier access and is essential for automating data into actionable solutions, including predictive maintenance models that need to correlate sensor values with specific asset types and failure modes, and digital twins that need to synchronize with specific physical assets.
Version contextual models for traceability: when the asset hierarchy changes (a machine is replaced, a production line is reconfigured), the historical data must remain interpretable under the old model. Versioning ensures that historical analysis can correctly interpret data from before the change.
Most DataOps programmes stall because context and quality break somewhere between the PLC and the analytics layer. We build the ingestion, contextualisation and Unified Namespace layer that keeps them intact.
Fix the pipeline between sensor and decision
Data silos block value at the fundamental level: systems that do not talk to each other cannot contribute to a shared operational picture. A quality system that does not receive real-time process data from SCADA cannot correlate quality outcomes with process conditions. A predictive maintenance application that cannot access the maintenance history records from the CMMS (computerized maintenance management system) cannot correlate sensor anomaly patterns with known failure events.
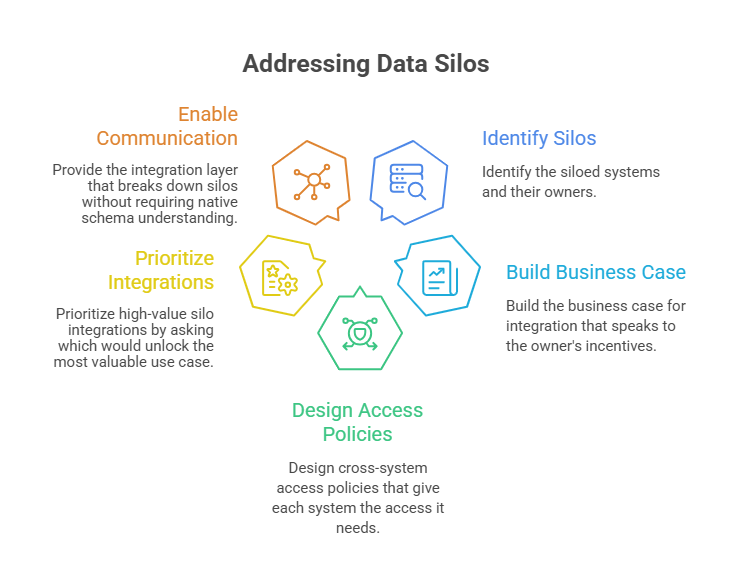
Silos are not solely a technical problem. They are also an organizational problem: systems have owners, and those owners have reasons (perceived or real) for controlling access to their data. Addressing silos requires identifying the siloed systems and their owners, building the business case for integration that speaks to the owner's incentives (better data for their own decisions, not just data for someone else's analytics), and designing cross-system access policies that give each system the access it needs without exposing data beyond its legitimate scope.
Prioritize high-value silo integrations by asking: which integration would unlock the most valuable analytics or operational use case? The SCADA-to-quality-system integration that enables real-time process-quality correlation analysis on the highest-defect-rate production line is more valuable to address first than a lower-value integration that is technically easier. Industrial DataOps enables systems to communicate effectively by providing the integration layer that breaks down silos without requiring each system to natively understand every other system's schema and protocol.
See also
Industry 4.0 Data Architecture Patterns: From Field to Enterprise
What Is OT/IT Integration? Architecture, Benefits, Challenges
OPC UA vs MQTT: Industrial Protocol Comparison
Security is a high priority in Industrial DataOps due to risks to equipment that IT-centric data governance frameworks do not address: a misconfigured access control on an industrial data platform can expose OT control systems to unauthorized access, with physical consequences that a database breach in an enterprise IT system does not produce.
Define who can read which data, who can write to which systems, and who can modify integration configurations or access control policies. In a converged OT/IT data environment, the principle of least privilege applies rigorously: an analytics application that needs to read process data for predictive maintenance does not need write access to any OT system. Role-based access control must cover not just the data platform but the integration layer, the MQTT broker, and the edge gateways.
Governance covers change management and version control for data models and integration configurations, as well as data catalogs that make the full data landscape discoverable and auditable. Model validation prevents poor-quality and non-compliant data from reaching systems that make operational decisions: a validation step that rejects a tag update with an impossible value (a temperature reading of -500°C from a sensor in a running furnace) prevents that invalid value from corrupting a digital twin or a predictive maintenance model.
Create an audit trail for data changes: who changed which configuration, when, and with what authorization. An audit trail is both a security control (detecting unauthorized changes) and a compliance record (demonstrating that governance procedures were followed). Companies face steep fines in regulated industries without proper governance roles and audit evidence; the specific regulatory requirements applicable to any given deployment should be verified with legal and compliance teams before finalizing the governance framework.
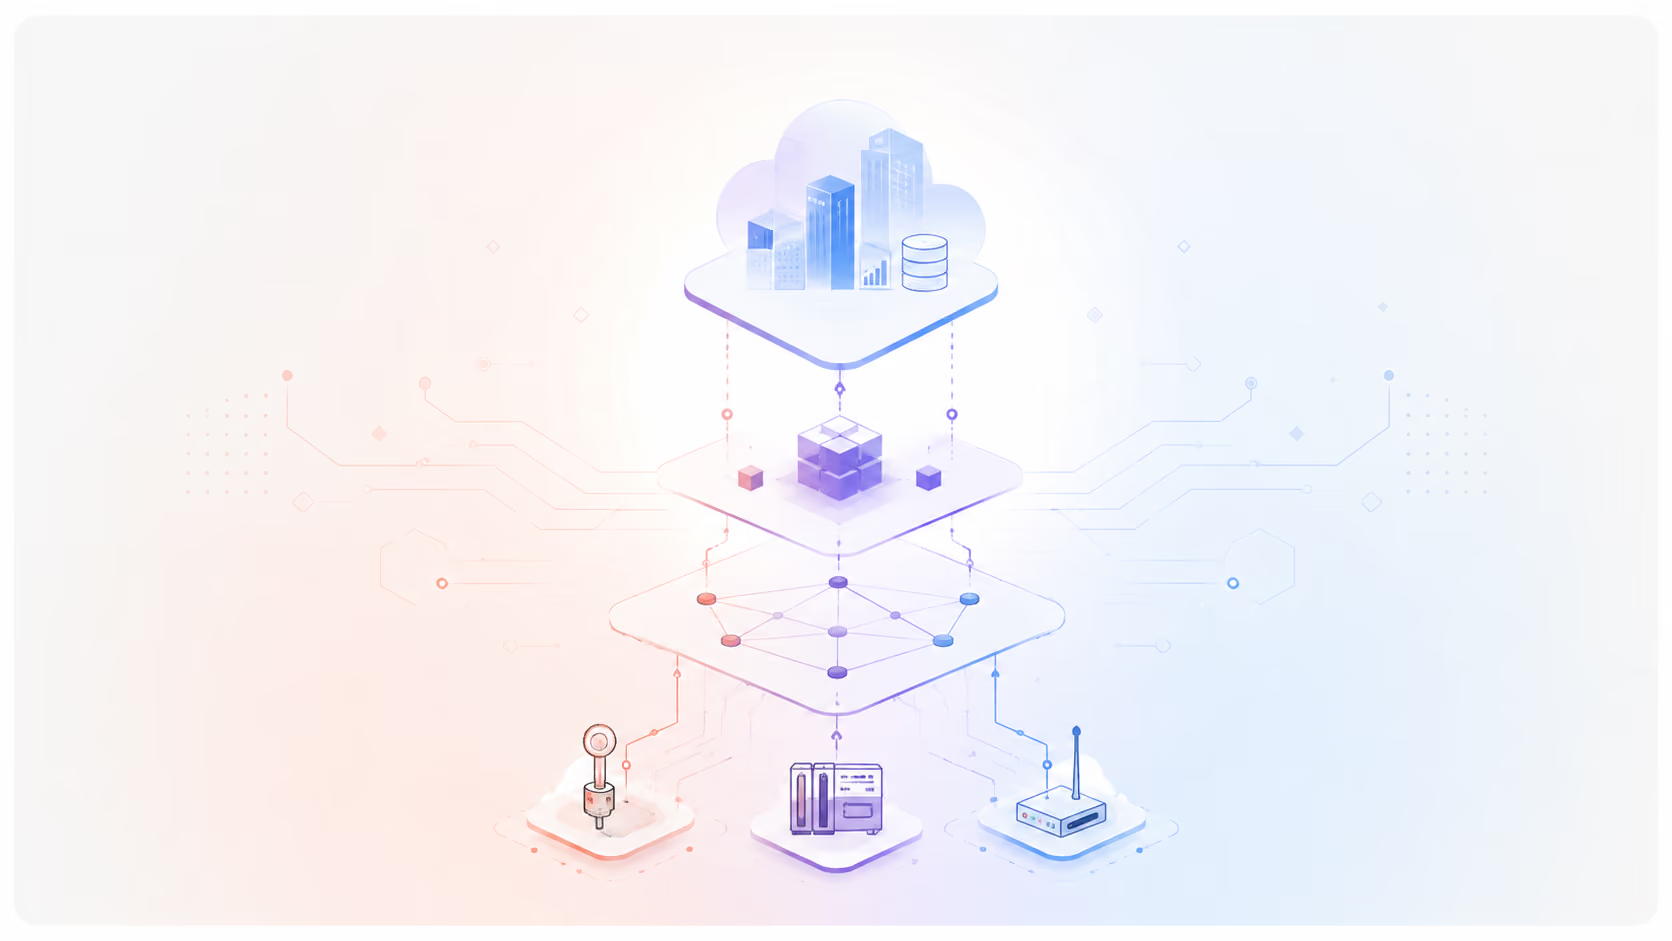
Industrial DataOps architecture follows Industry 4.0 data architecture patterns that have been proven in real deployments. Two patterns cover the majority of industrial integration use cases: the Unified Namespace for real-time integration, and edge-first with cloud for the hybrid persistence and analytics architecture.
Data orchestration enables bidirectional data flow across systems: not just from field to enterprise (the primary data direction) but from enterprise to field when closed-loop optimization, setpoint management, or production parameter distribution is part of the use case. The architecture must accommodate this bidirectional data flow without creating security vulnerabilities that let enterprise IT systems directly reach OT controllers.
A Unified Namespace (UNS) organizes and abstracts industrial data and ensures consistent naming across industrial assets. Rather than point-to-point integrations between every data source and every analytics consumer, all systems publish and subscribe to a single MQTT broker using a topic hierarchy that reflects the site's asset hierarchy.
Designing a UNS for site-level data. The topic hierarchy should follow the plant topology: site, area, line, machine, measurement. Every tag in the estate has an unambiguous topic path that reflects where it comes from and what it represents. A temperature reading from extruder 3's inlet becomes PlantA/ProductionArea/Line3/Extruder3/InletTemp. Any system that subscribes to PlantA/ProductionArea/Line3/# receives all data from all sensors on all machines in line 3.
Mapping UNS topics to semantic models. Each topic in the UNS should have a corresponding semantic model entry: the engineering unit, the valid range, the asset hierarchy position, and the contextual attributes (what process, what product, what shift context this tag belongs to). This mapping is what converts a topic from a string label into a self-describing data element that analytics systems can consume without external documentation.
Testing UNS performance under load. Validate the MQTT broker's throughput and latency under the full projected message rate before connecting production consumers. An underspecified broker that cannot handle peak message volume becomes a bottleneck that degrades real-time data processing across the entire connected estate.
Edge devices manage rapid localized tasks and sync summary data to the cloud: the edge-first pattern handles all time-sensitive processing locally, at the plant, while the cloud handles long-term storage, analytics at scale, and model training.
Edge processing for conditioning. The edge layer handles protocol translation (Modbus to MQTT), data quality validation, unit normalization, and real-time analytics that require sub-second latency. Edge devices apply the local quality rules described earlier, filter and aggregate raw telemetry into the formats the UNS expects, and buffer data locally during connectivity interruptions (store-and-forward).
Cloud role for long-term storage. Cloud platforms provide the elastic storage and compute for analytics workloads that the edge cannot economically handle: training ML models on years of historical data, running multi-site analytics that aggregate data from many plants, and storing raw operational data at the volumes and retention periods that regulatory requirements demand. Cloud storage receives contextualized, validated data from the edge, not raw unfiltered telemetry.
Secure transport between edge and cloud. All data movement between edge and cloud must be encrypted in transit (TLS), authenticated (certificate-based device identity), and monitored (logging all connections and data flows). The edge-to-cloud transport path must not create a route for cloud-originated traffic to reach OT systems: data flows one way (edge to cloud) for telemetry, and any cloud-to-edge flows (model updates, configuration changes) must pass through a controlled deployment pipeline with authentication and integrity validation.
A hybrid model uses both edge and cloud for analytics and model improvement: the edge handles inference for time-sensitive predictions, the cloud handles model training and retraining on accumulated historical data, and the resulting improved models are deployed back to the edge through a governed update pipeline.
The answer-first guidance: start narrow, scale with governance.
Phase 1: Identify top-priority industrial applications and run a narrow pilot (weeks 1 to 12). Select one high-value use case (predictive maintenance on the plant's highest-unplanned-downtime asset class, real-time OEE on the highest-volume production line) and one production line or cell as the pilot scope. Define the KPIs before deployment begins. Implement the minimum viable pipeline: edge gateway for protocol normalization, UNS for data distribution, a single analytics application consuming the UNS output. Validate data quality end-to-end before declaring the pilot ready for evaluation.
Phase 2: Validate, learn, and establish governance (weeks 8 to 20). Measure the pilot against its pre-defined KPIs. Document what worked, what broke, and what the data revealed about process behavior that was previously invisible. Establish the UNS taxonomy and semantic model standards that will govern the scale-up: inconsistency in naming and modeling at the pilot stage becomes expensive technical debt at the enterprise scale.
Phase 3: Scale successful pilots site by site (months 6 to 24+). Apply the pilot architecture and governance standards to additional production lines, areas, and sites. Embed governance before enterprise rollout: the data catalog, access control framework, and quality validation standards must be in place before the data landscape becomes too large to govern retroactively. Industrial DataOps enables faster time-to-insight and scaling of digital initiatives precisely because the foundational governance and architecture established in the pilot phases make each subsequent rollout faster and more reliable than the one before.
Industrial DataOps is not a project with an end date; it is an operational capability that produces value through continuous improvement of both the data pipelines and the production processes they serve.
Every data pipeline should have corresponding production outcome KPIs that demonstrate its business value: not just "pipeline latency is 200ms" but "unplanned downtime on line 3 reduced by X% since predictive maintenance was activated." Data observability enables continuous monitoring of data quality and performance, catching pipeline degradation before it affects the production outcome KPIs that business stakeholders track.
Industrial DataOps creates the data infrastructure that makes controlled process experimentation possible: running a proposed process parameter change on one production cell while the adjacent cell continues with the current parameters, with both monitored by the same data platform, produces clean experimental evidence for decisions that previously required intuition or across-the-board rollouts.
The operator who uses the predictive maintenance alert every day knows whether it is firing too early, too late, or incorrectly. Industrial DataOps improves operational efficiency through real-time insights that operators act on; capturing whether those insights are actionable and accurate is the feedback loop that improves the models and the pipelines over time. Without regular operator feedback, the data platform produces insights that look good in a dashboard but do not reflect the actual operational experience.
Industrial DataOps requires a new kind of professional that sits at the intersection of OT operations and IT data engineering: the Context Engineer, who understands both the physical process well enough to know what data is meaningful and the data pipeline well enough to ensure that meaning is preserved through to the analytics layer.
The Context Engineer's responsibilities include: defining and maintaining the semantic models that contextualize OT data; designing the UNS topic taxonomy in consultation with OT operations; validating that data flowing through the pipeline accurately represents the physical process; and translating between the vocabulary of OT engineers (who think in terms of instruments, process steps, and production states) and IT data engineers (who think in terms of schemas, APIs, and data models).
OT staff training. OT operators and technicians do not need to become data engineers, but they benefit from a working understanding of how their equipment data reaches the analytics applications that generate maintenance alerts, quality flags, and production performance dashboards. Understanding the data pipeline at a conceptual level makes OT staff better partners in identifying data quality issues and explaining anomalies that the data platform surfaces.
Cross-functional ownership. Assign explicit ownership for each data flow to a named individual or team with accountability for both the operational performance of the pipeline and the business outcome it supports. Industrial DataOps facilitates collaboration between IT and operational teams by making both accountable for shared outcomes: data pipeline reliability (an IT metric) and production outcome improvement (an OT metric) are both visible in the same performance dashboard.
Industrial DataOps maturity is not measured solely by technical pipeline metrics; it is measured by the production outcomes that depend on those pipelines.
KPI table
| Dimension | Metric | Target (indicative) |
|---|---|---|
| Data quality | Completeness rate per critical tag | >98% of expected readings present per shift |
| Data quality | Accuracy: out-of-range value rate | <0.5% of readings failing local validation |
| Pipeline performance | End-to-end latency from sensor to dashboard | Defined per use case; typically <10 seconds for operational monitoring |
| Pipeline reliability | Pipeline uptime | >99.5% for production-critical flows |
| Business outcome | Unplanned downtime on connected assets | Measurable reduction compared with the pre-DataOps baseline |
| Business outcome | Time to insight after a production event | Reduction from hours with manual processes to minutes with automated processes |
| DataOps maturity | Coverage of assets with contextualized UNS presence | Target of 80% or more of priority assets within 12 months |
High-quality and governed data is crucial for effective AI applications in industry: a predictive maintenance model is only as reliable as the sensor data it trains and infers on. Tracking data quality metrics alongside model performance metrics closes the causal loop: when a model's predictions degrade, data quality metrics often reveal the root cause before a model diagnostic does.
Maturity assessment. Assess organizational DataOps maturity periodically across five dimensions: data coverage (what fraction of priority assets generate data in the UNS), data quality (measured by the metrics above), integration breadth (what OT and IT systems are connected), analytics adoption (are decisions actually being driven by DataOps-generated insights), and governance completeness (are access controls, audit trails, and data catalogs in place and maintained).
Predictive maintenance and real-time operational visibility are the two highest-value and highest-adoption Industrial DataOps use cases. Prioritize predictive maintenance pilots on the asset classes with the highest unplanned downtime cost: rotating machinery (compressors, pumps, motors), high-value tooling in precision manufacturing, and critical process equipment where a failure causes a safety incident rather than just a production delay. Asset maintenance that uses Industrial DataOps infrastructure shifts from time-based scheduling (replace bearings every six months) to condition-based scheduling (replace bearings when the vibration signature indicates imminent failure), reducing maintenance cost while improving asset reliability.
Map quality analytics to production lines with the highest defect rates or the greatest quality-related cost. A vision inspection system that logs every defect by type, location, and time, connected through the DataOps pipeline to process data from the same production period, enables correlation analysis that identifies which process conditions predict which defect types, driving corrective action that eliminates the root cause rather than just detecting the symptom.
Outline energy-optimization experiments using Industrial DataOps infrastructure: connecting energy metering data from every major consumer in the plant to the same UNS that carries production data enables granular analysis of energy consumption per unit of output, identification of equipment that consumes disproportionate energy relative to its production contribution, and optimization of utility scheduling to minimize consumption during peak-tariff periods. Sophisticated analytics on connected energy data can produce double-digit percentage reductions in energy intensity per unit of output for manufacturers who have not previously had metering at this granularity.
InTechHouse approaches Industrial DataOps as a delivery partner in industrial data platform development, not a platform vendor: the goal is a working data pipeline in a real plant, producing measurable production outcomes, not a feature-complete platform demonstration in a controlled environment. Every pilot is scoped to a specific production line, with specific KPIs and a specific rollback plan, because abstract demonstrations of Industrial DataOps capability do not transfer to production value as reliably as narrow, measurable pilots do.
The key patterns that transfer from pilot to scale: edge gateway deployment for protocol normalization is almost always the critical-path item on the first pilot and becomes routine by the third deployment. The UNS topic taxonomy that took weeks to define on the first pilot takes days on subsequent plants because the asset-hierarchy standard is already established. The data quality validation rules that were discovered empirically on the first line apply, with modifications, to every subsequent line of the same equipment type.
InTechHouse case study: Industrial DataOps pipeline on a manufacturing plant
InTechHouse built an industrial data pipeline for a manufacturing operator whose production data was fragmented across a SCADA historian, a quality system database, and spreadsheet-based maintenance records, with no automated path connecting them and engineers spending significant time each shift manually compiling data for production performance reporting.
The deployment began with edge gateway installation to normalize legacy Modbus and EtherNet/IP devices to OPC UA, followed by UNS establishment on an MQTT broker with a topic taxonomy aligned to the plant's line-machine-measurement hierarchy. Edge validation rules were applied at the gateway layer to catch stuck signals and out-of-range values before they reached the UNS, reducing the data quality exceptions that had previously propagated undetected to the historian.
Contextualization metadata (production order, product, shift, operator) was attached to each data record automatically by pulling from the MES API and joining on the timestamp, eliminating the manual context-annotation step that had previously required a data engineer's time on every analytics query. The resulting pipeline gave the operations management team real-time OEE visibility without manual compilation, and provided the sensor data foundation for a predictive maintenance pilot on the plant's highest-downtime compressor group within three months of go-live.
We start with one production line, prove data quality end to end, then scale with governance already in place. Ask us to walk you through a recent plant deployment.
See our industrial data platform delivery process
Start with business outcomes, not tools. The Industrial DataOps infrastructure is the means; reduced unplanned downtime, faster quality response, and energy cost reduction are the ends. Every architecture decision should be traceable to a production outcome KPI.
Pilot narrow, scale with governance. A pilot on one production line with pre-defined KPIs and a rollback plan produces learning that scales. A broad rollout without governance produces data debt that takes longer to remediate than it took to accumulate.
Monitor continuously and iterate. Data quality degrades over time as equipment changes, production processes evolve, and new data sources are added. Data observability is not a launch deliverable; it is an ongoing operational function that catches drift before it corrupts the analytics that production decisions depend on.
The continuous improvement loop, better data enabling better decisions enabling better production outcomes enabling resources for further DataOps investment, is the compounding return on Industrial DataOps that justifies the initial program investment.
To discuss an Industrial DataOps deployment, including architecture design, pilot scoping, and governance framework, talk to the InTechHouse team.
Not sure where to start? We work with companies at every stage, from early ideas to enterprise-level builds. A 30-minute call can save you months of guesswork.
What is Industrial DataOps?
Industrial DataOps is a methodology for managing data in motion across an industrial environment, integrating OT (operational technology), IT, and ET (engineering technology) data and delivering it in context to operational and business decisions. It applies DevOps, Agile, and Lean principles to industrial data pipelines, with the specific adaptations required for the latency, determinism, and safety constraints of manufacturing and process industry environments.
How is Industrial DataOps different from classic DataOps?
Classic DataOps focuses primarily on data at rest in enterprise IT systems: transforming and governing datasets in data warehouses and lakes. Industrial DataOps focuses on data in motion across OT and IT systems: the real-time pipeline from sensor to decision, with latency requirements measured in milliseconds to seconds, reliability requirements tied to physical process safety, and integration challenges posed by legacy OT protocols that enterprise DataOps frameworks do not address.
What is a Unified Namespace?
A Unified Namespace is a single, consistently structured MQTT broker that all OT and IT systems in an industrial estate publish and subscribe to. Rather than point-to-point integrations between every data source and every consumer, all systems connect to the same broker using a topic hierarchy that reflects the plant's asset topology. Adding a new data consumer requires only a new subscription to the broker, not a new integration to each source. The UNS organizes and abstracts industrial data and ensures consistent naming across industrial assets, making the data landscape discoverable and governable.
Why check data quality at the edge?
Data quality issues discovered at the cloud or analytics layer require expensive retroactive remediation and may have already corrupted downstream outputs. Checking quality at the edge, at the gateway where data leaves the production network, catches problems when correction is still possible: a stuck signal can be flagged before it propagates to the historian, an out-of-range value can be rejected before it reaches the analytics model, and a timestamp anomaly can be corrected before it desynchronizes a digital twin. Quality checks at the source also reduce the volume of invalid data that consumes storage and bandwidth between the edge and the cloud.
How do you start an Industrial DataOps deployment?
Start with a business outcome, not a technology selection. Identify the highest-value use case (predictive maintenance on the highest-unplanned-downtime asset class is the most common starting point) and the production line or cell that will be the pilot scope. Conduct an asset and protocol inventory for the pilot scope. Deploy edge gateways to normalize the pilot scope's protocols to OPC UA or MQTT. Establish the Unified Namespace with a governed topic taxonomy. Validate data quality end-to-end from sensor to analytics consumer. Measure against the pre-defined KPIs for at least one production cycle before expanding scope.
Jacek Suty is Head of Solution Architecture at InTechHouse, with more than 30 years of experience in system architecture, enterprise IT, infrastructure, information security, and complex digital transformation programs.
He specializes in designing enterprise and solution architectures, translating business and regulatory requirements into scalable technology platforms, and coordinating delivery across software, infrastructure, data, and security teams. His work covers enterprise architecture based on TOGAF, system modeling using UML and BPMN, cloud and on-premise infrastructure, CI/CD processes, data platforms, cybersecurity, and IT governance.
Jacek has contributed to large-scale technology programs for public institutions, finance, energy, education, healthcare, utilities, and digital archives. His project experience includes nationwide public digital infrastructure, distributed document-management and archiving systems, data-exploration platforms using machine learning and predictive analytics, and transaction systems combining blockchain, metadata standards, and computational intelligence.
He holds PRINCE2 Practitioner, Management of Risk, Scrum Master, ITIL Foundation, and ISO/IEC 27001 Lead Auditor qualifications. Jacek is currently pursuing a doctoral degree at Bydgoszcz University of Science and Technology, combining academic research with extensive experience in real-world architecture and technology delivery.
He writes about enterprise architecture, system design, digital transformation, data platforms, cloud infrastructure, cybersecurity, technology governance, and the practical application of AI in complex information systems.
Jacek Suty's academic and professional profiles:
https://pbs.edu.pl/pl/doktorant/uczelniania-rada-samorzadu-doktorantow
https://www.isep.pw.edu.pl/isep/zs/Aktualnosci/Kalendarium-wydarzen2/Seminarium-zakladowe-9.03.2021-Jacek-Suty
https://aionehealth.pl/wp-content/uploads/2026/04/Raport-2026-final.pdf
This initial conversation is focused on understanding your product, technical challenges, and constraints.
No sales pitch - just a practical discussion with experienced engineers.
Share a few details about your product and context. We’ll review the information and suggest the most appropriate next step.