In today’s fast-paced and data-driven business world, organizations need to make informed decisions quickly to stay ahead of the competition. This is where business intelligence comes in. Business intelligence, or BI, is a set of tools and practices that enable organizations to collect, analyze, and interpret data to make informed decisions. In this article, we’ll explore what business intelligence is, why it’s important, and what it can do for your organization.
Business intelligence, or BI, is a technology-driven process of collecting, analyzing, and interpreting data to support business decision-making. BI aims to transform raw data into actionable insights that can be used to optimize business processes, identify opportunities, and gain a competitive edge. The history of BI can be traced back to the late 1950s when IBM researcher Hans Peter Luhn first coined the term “business intelligence.” Today, BI is a critical part of the IT industry, with a wide range of tools and technologies available.
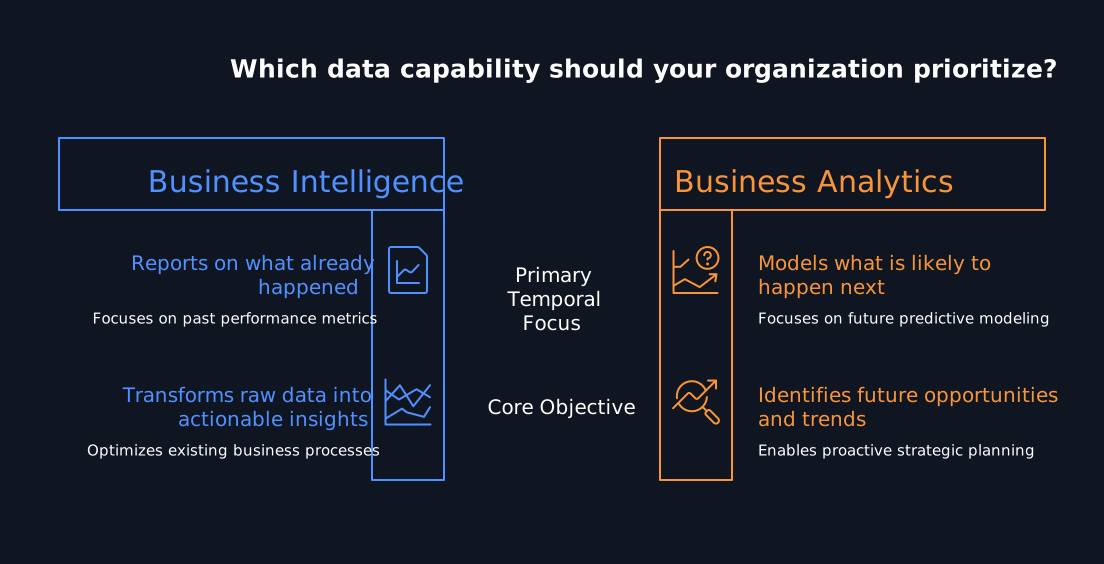
Business intelligence is often used interchangeably with business analytics, yet the two answer different questions: BI reports on what already happened, while analytics models what is likely to happen next. If you are deciding which capability to build first, the comparison of business analytics vs business intelligence shows where each one pays off.
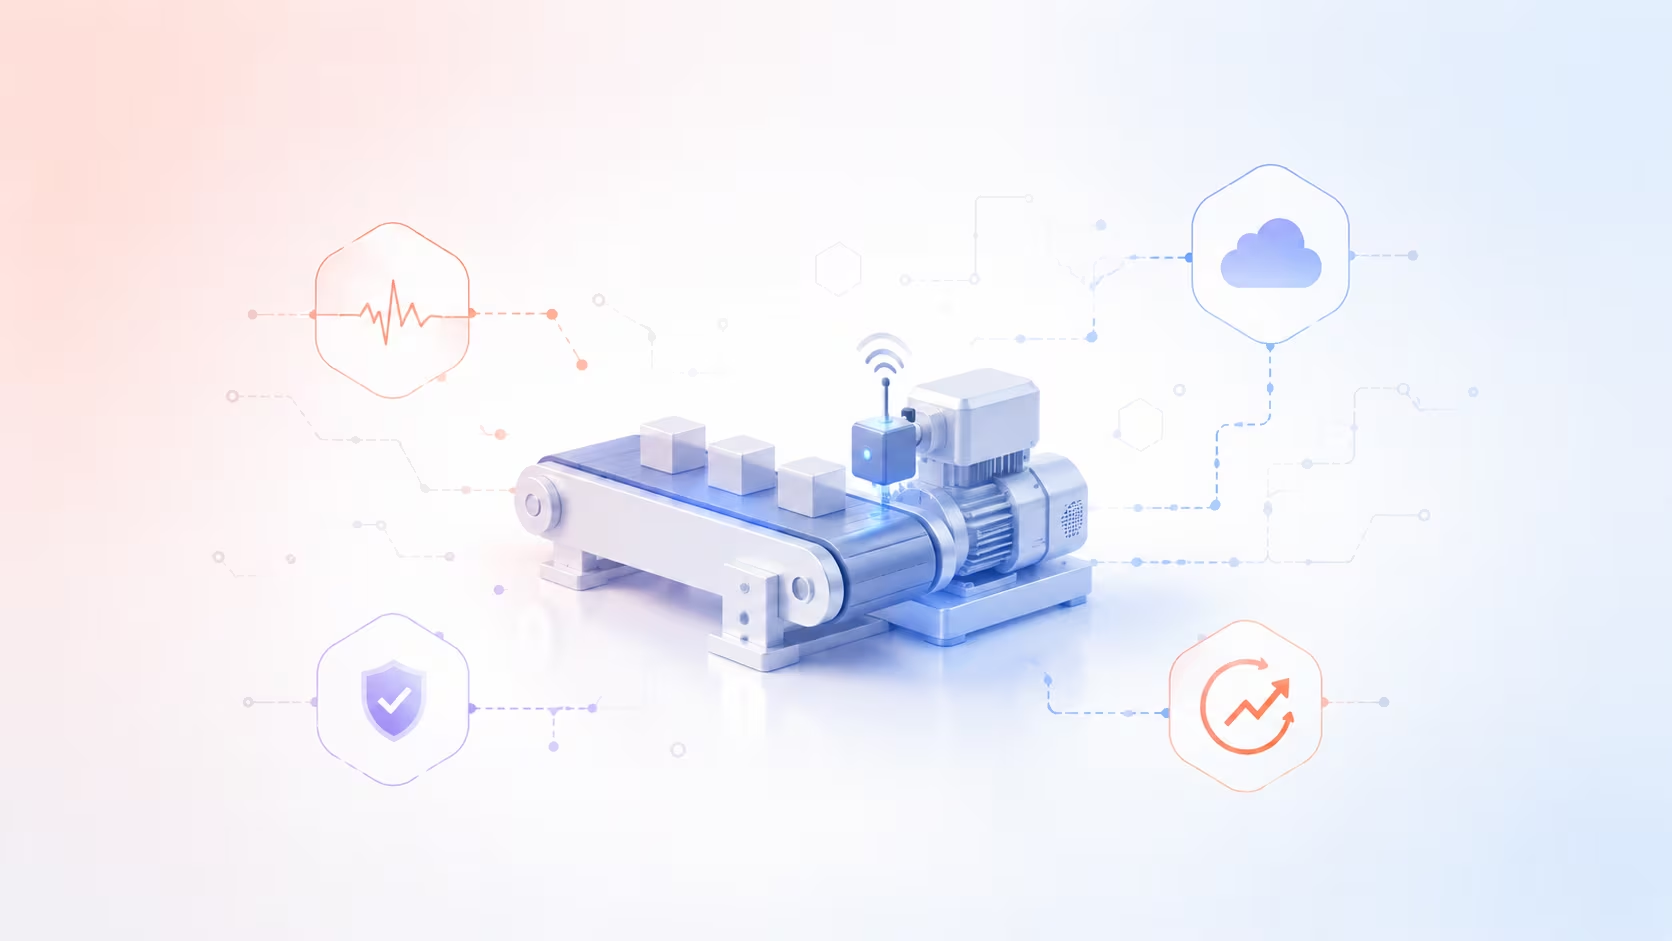
Most BI tools stop at ERP tables and never touch the line. We connect production and sensor data to your reporting layer so operations see the same numbers as finance.
The Business Intelligence (BI) market has been growing rapidly in recent years, driven by the increasing demand for data-driven insights across industries. Popular BI vendors include Microsoft, IBM, Oracle, SAP, and Tableau. Popular BI technologies include Tableau, Microsoft Power BI, QlikView, SAP BusinessObjects, and Oracle BI.
Identifying market trends is essential for businesses operating in the business intelligence industry. Steps include: conducting market research, analyzing industry reports, monitoring social media, attending industry events, and utilizing data analytics tools.
Trend detection increasingly runs on models rather than manual review. Algorithms trained on historical sales, sensor and customer data flag shifts long before they surface in a monthly report, which is why the role of machine learning in data analytics now sits at the centre of most BI roadmaps.
BI systems typically follow four steps: Data Collection, Data Integration, Data Analysis, and Data Presentation.
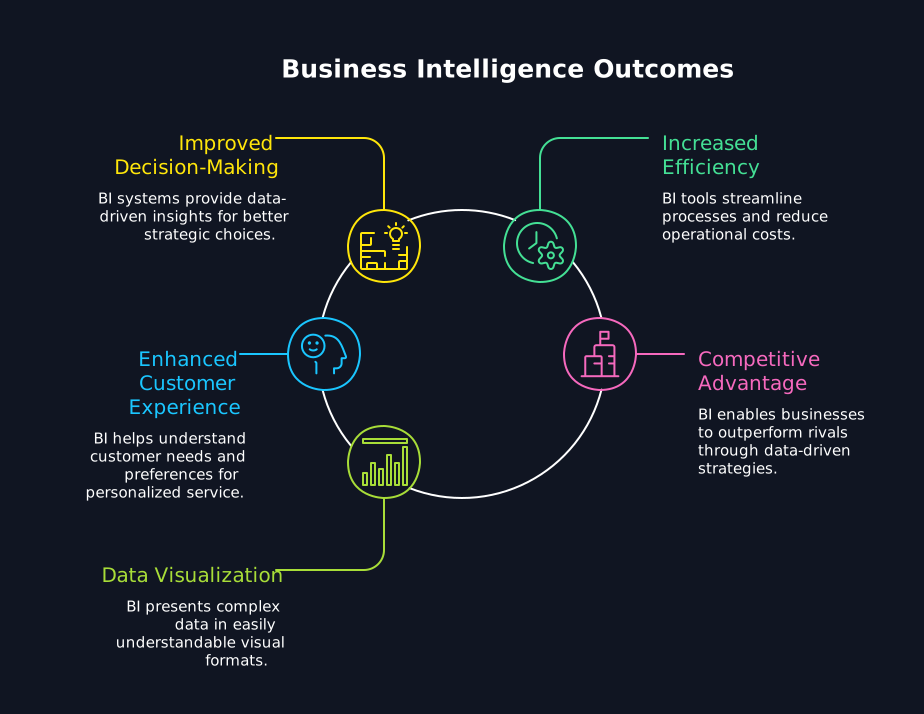
BI delivers Improved Decision-Making, Increased Efficiency, Enhanced Customer Experience, Competitive Advantage, and Data Visualization.
InTechHouse is a technology solutions company that specializes in providing business intelligence (BI) services to clients across different industries. The Expense Analyser tool was designed to help clients track and analyze their resources based on information from energy meters and experts. It enables the effectively translate of these data into satisfying results.
Read also:
By using BI, companies can identify trends, patterns, and insights that can help them improve their operations, increase efficiency, and gain a competitive advantage. BI also allows businesses to create reports and dashboards that provide real-time information to stakeholders. Overall, BI is a crucial component of modern business operations and can provide significant benefits to companies of all sizes and industries.
Our Expense Analyser project translated raw energy meter readings into decisions operators actually use. Ask us to walk you through the data model behind it.
Not sure where to start? We work with companies at every stage, from early ideas to enterprise-level builds. A 30-minute call can save you months of guesswork.
Business intelligence (BI) is the combination of processes and software that collects data from operational systems, integrates it into a consistent model and presents it as reports and dashboards for decision-making. Its focus is on reliable answers to recurring questions about past and current performance, such as sales by region or output per line. The term in its modern sense goes back to IBM researcher Hans Peter Luhn, who used it in a 1958 paper.
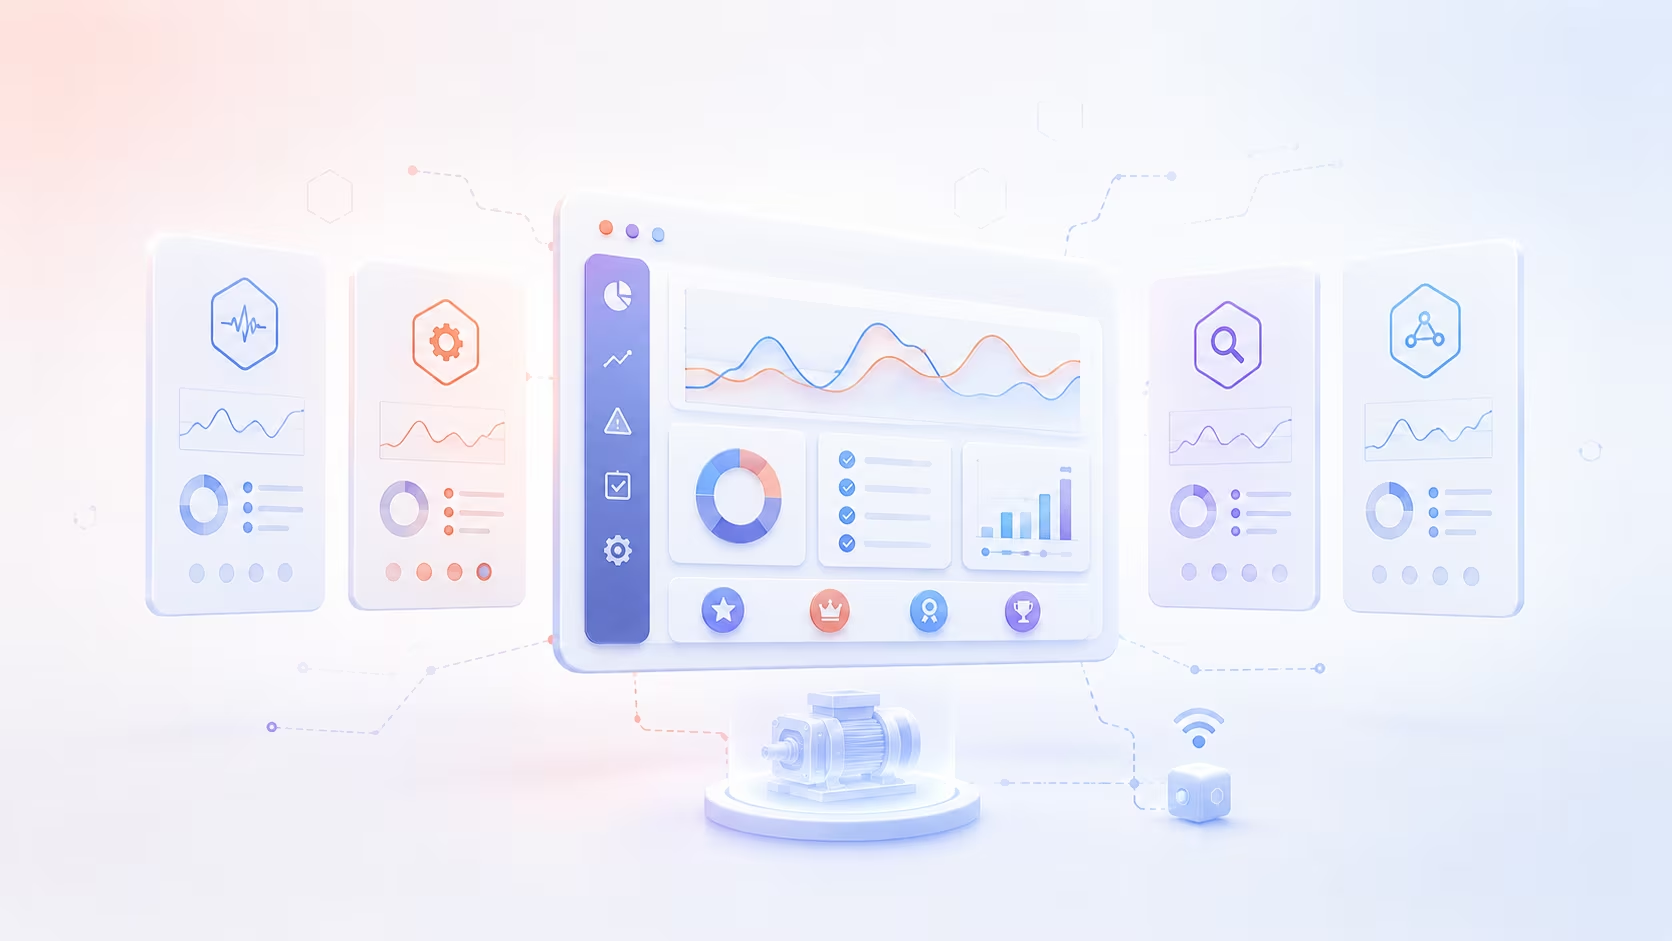
A typical BI architecture has four layers: source systems, an integration layer (ETL or ELT pipelines), a data warehouse or lakehouse, and a presentation layer with a semantic model and dashboards. The semantic model defines metrics such as margin or OEE once, so every report calculates them identically. Common stacks combine tools such as Fivetran or Azure Data Factory, Snowflake or BigQuery, and Power BI or Tableau. Skipping the semantic layer is a frequent cause of conflicting numbers.
BI systems can use machine and sensor data from production, provided the data is aggregated into business-relevant units such as shifts, batches or energy consumption per product before it reaches the reporting layer. Raw sensor streams at millisecond resolution overwhelm most BI models. The usual path runs from PLCs or meters through a historian or IoT gateway into the warehouse, where it is joined with ERP data. That join lets operations and finance see the same figures.
An organization needs a dedicated BI platform when the same figures are rebuilt manually each reporting cycle, when departments present conflicting numbers for the same metric, or when data comes from more than a few systems. Spreadsheets work for exploration and small teams but lack version control, access management and automated refresh. A BI platform centralizes definitions and permissions. The move pays off once manual report preparation consumes regular analyst days every month.
Business intelligence on its own cannot explain causes or reliably predict outcomes; it shows what happened, where and how much, based on data that has already been recorded. It also cannot correct poor source data, because reports faithfully reproduce input errors. Forecasting, root-cause analysis and optimization require statistical or machine learning methods layered on top. BI is also only as timely as its refresh schedule, which is often daily rather than real time.

Jacek Suty is Head of Solution Architecture at InTechHouse, with more than 30 years of experience in system architecture, enterprise IT, infrastructure, information security, and complex digital transformation programs.
He specializes in designing enterprise and solution architectures, translating business and regulatory requirements into scalable technology platforms, and coordinating delivery across software, infrastructure, data, and security teams. His work covers enterprise architecture based on TOGAF, system modeling using UML and BPMN, cloud and on-premise infrastructure, CI/CD processes, data platforms, cybersecurity, and IT governance.
Jacek has contributed to large-scale technology programs for public institutions, finance, energy, education, healthcare, utilities, and digital archives. His project experience includes nationwide public digital infrastructure, distributed document-management and archiving systems, data-exploration platforms using machine learning and predictive analytics, and transaction systems combining blockchain, metadata standards, and computational intelligence.
He holds PRINCE2 Practitioner, Management of Risk, Scrum Master, ITIL Foundation, and ISO/IEC 27001 Lead Auditor qualifications. Jacek is currently pursuing a doctoral degree at Bydgoszcz University of Science and Technology, combining academic research with extensive experience in real-world architecture and technology delivery.
He writes about enterprise architecture, system design, digital transformation, data platforms, cloud infrastructure, cybersecurity, technology governance, and the practical application of AI in complex information systems.
Jacek Suty's academic and professional profiles:
https://pbs.edu.pl/pl/doktorant/uczelniania-rada-samorzadu-doktorantow
https://www.isep.pw.edu.pl/isep/zs/Aktualnosci/Kalendarium-wydarzen2/Seminarium-zakladowe-9.03.2021-Jacek-Suty
https://aionehealth.pl/wp-content/uploads/2026/04/Raport-2026-final.pdf
From first prototype to production, our engineers can help you scope it, build it and get it certified.
This initial conversation is focused on understanding your product, technical challenges, and constraints.
No sales pitch - just a practical discussion with experienced engineers.
Share a few details about your product and context. We’ll review the information and suggest the most appropriate next step.