.avif)

Passenger counting AI is computer vision software that produces accurate, real-time counts of people boarding, alighting, and present in a vehicle or space, using camera feeds processed on-device rather than manual observation or simple infrared beam sensors. The objective sounds straightforward until crowds enter the picture: accuracy depends entirely on handling occlusion, which is why crowd density estimation and heatmaps matter as much as head detection. A system that only detects individual heads will silently fail the moment a platform or cabin gets crowded enough that heads start overlapping in the camera's view.
Key Takeaways
This guide is written for two audiences: transit and retail operators evaluating passenger counting technology, and the engineers who build and deploy these systems. Both groups run into the same core problem from different angles, manual counts and simple sensor-only counts are inaccurate in crowds, and the gap between an ideal accuracy figure on a vendor spec sheet and what a system actually delivers in a packed rush-hour cabin is where most procurement decisions go wrong.
Manual counting does not scale: a staff member counting passengers at a busy stop will miss people, double-count others, and cannot operate continuously across a full service day. Beam-break and simple infrared sensors are reliable at low occupancy but degrade badly once people cluster together near a doorway, since these sensors fundamentally cannot distinguish one person from two people standing close together.
The core benefits for transport and retail operators are operational, not just technical. Real-time data can enhance passenger experience by avoiding overcrowding: accurate occupancy levels let an operator redirect passengers to less crowded vehicles, trigger additional service, or simply inform waiting passengers honestly about how crowded the next arrival will be. Retail operators get an equivalent benefit in footfall and occupancy tracking for staffing and layout decisions. The number of people in a space, tracked accurately and continuously, turns out to be a remarkably high-leverage piece of operational data once it is actually reliable.
Cameras mounted near doorways or covering the full cabin count boarding and alighting passengers at each stop, building a running occupancy total for the vehicle. This is the most common deployment pattern and the one with the most direct line to dispatch decisions.
Station and platform cameras estimate crowd density across the waiting area, feeding both passenger information displays (showing real-time crowding to arriving passengers) and operational alerts when density approaches a safety threshold.
Store entrance and zone cameras count customers entering, track occupancy by zone, and feed staffing and layout decisions, using largely the same underlying technology as transit applications with different downstream consumers of the count.
Schedule optimization is the most direct: real-time data lets transit agencies dynamically optimize schedules and dispatch additional service when occupancy data shows sustained overcrowding on a route, rather than relying on fixed timetables built from historical averages. Dwell time at stops correlates with boarding volume; accurate per-stop counts let an operator identify which stops are driving schedule slippage. Dynamic passenger information systems use real-time data for occupancy tracking, displaying live crowding estimates to passengers before they board, which measurably shifts passenger distribution across a service when people can see which vehicle or platform section is less crowded.
Density data is not just an operational nicety. Past a certain occupancy threshold, platform and onboard crowding becomes a genuine safety concern, crush risk at platform edges, blocked emergency egress paths, and difficulty maintaining clear sightlines for staff. Density-driven overcrowding alerts give operators an early warning before a crowding situation becomes a safety incident, connecting passenger counting directly to the broader practice of industrial and public safety monitoring.
AI-driven video analytics can improve operational efficiency and reduce costs across all of these use cases simultaneously, because a single camera deployment and inference pipeline can feed scheduling, safety, and passenger information systems at once, rather than requiring separate sensor infrastructure for each function.
A count tells an operator how full a vehicle is, not what is happening inside it. Pairing the counting model with human pose estimation and action recognition turns occupancy data into behavior data, which is what a safety alert actually needs.
PyTorch and TensorFlow (with TensorFlow Lite or PyTorch Mobile for edge deployment) are the standard training frameworks for both detection-based and density-estimation models. ONNX Runtime provides a hardware-agnostic deployment path that simplifies moving a trained model across different edge accelerator targets without retraining for each one.
OpenCV remains the standard for preprocessing (frame extraction, resizing, color space conversion) and classical computer vision operations that often precede or supplement the deep learning pipeline. Ultralytics' YOLO family provides production-ready object detection models suitable for the detection-based counting approach covered in the next section, and they pair with small object detection with SAHI when heads are only a few pixels across.
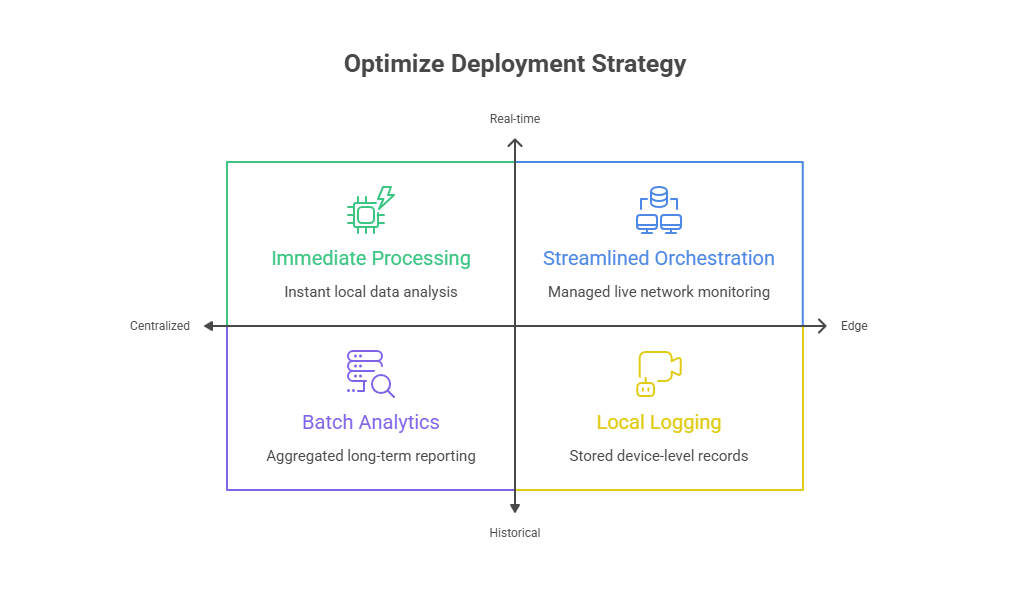
A spectrum from onboard edge compute to server deployment depending on the use case: a single-camera, single-doorway counting application can run on a compact embedded NPU drawing a few watts; a multi-camera platform-wide density estimation system processing several 1080p streams simultaneously needs a more substantial edge AI compute unit (an NVIDIA Jetson-class device, for example); a centralized analytics platform aggregating counts across an entire fleet or station network for historical reporting can run on conventional server infrastructure, since that aggregation workload is not latency-sensitive in the way live counting is.
Docker containers for the inference pipeline simplify deployment consistency across a heterogeneous fleet of edge devices. For larger deployments managing many edge nodes, lightweight orchestration tools (k3s or similar resource-constrained Kubernetes distributions) support centralized model updates and health monitoring without the overhead of a full Kubernetes control plane on each edge device.
Passenger counting solutions can integrate with existing video systems rather than always requiring new camera infrastructure: if existing CCTV cameras provide adequate resolution and field of view, an edge AI compute unit can be added to process those existing feeds without a full camera replacement. APC (automatic passenger counting) systems can use edge computing for instant data processing, which is the architectural default for any application where the count needs to inform a real-time decision rather than only feed a historical report.
Vendor accuracy figures collapse the moment heads start overlapping in a packed cabin. We build density-based counting that degrades gracefully under occlusion and we validate it on your own footage, not a demo set.
Get counting accuracy that holds up at rush hour
This is the section that separates a passenger counting system that works in a real deployment from one that only works in the vendor's demo video. The core decision: when occlusion is light, detect and count heads; when crowds occlude each other, switch to density estimation and crowd heatmaps because you cannot reliably separate individuals.
A head or person detector (commonly a YOLO variant or a dedicated head-detection model) localizes each individual in the frame, and the count is simply the number of detections. This approach works well at low to moderate density, where most people are at least partially visible and distinguishable from their neighbors. It also has the advantage of providing individual positions, which supports tracking-based boarding and alighting counts (did this specific detected person cross the doorway threshold).
Rather than attempting to detect and count discrete individuals, a density estimation model predicts a continuous density map across the image, where the value at each pixel represents the local density of people, and the total count is obtained by integrating (summing) the density map across the frame. Density maps highlight individual heads for crowd counting in sparse regions while smoothly representing the continuous blob of people in dense regions where individual heads genuinely cannot be separated in the 2D camera projection. This is the fundamental reason density estimation exists: past a certain crowd density, the underlying detection problem (where exactly does one person end and the next begin) becomes genuinely ill-posed from a single 2D viewpoint, no matter how good the model is.
Detection-based counting handles low to moderate crowd density well, as long as sightlines stay clear. It outputs individual bounding boxes or positions for each person detected, which makes it useful when precision on individual location matters. The catch: it breaks down under heavy occlusion, when people start overlapping in the frame.
Density estimation takes the opposite approach and works precisely where detection struggles: moderate to extreme density with significant occlusion. Instead of tracking individuals, it produces a continuous density map along with an integrated count. The tradeoff is that you lose individual identity and position entirely; you get a number, not a list of people.
Detection plus tracking is built for a narrower job: counting people as they board or alight at a defined threshold, like a doorway. It gives individual counts of people crossing that line. Occlusion is still a limitation here too, and it shows up specifically at the threshold itself, where people tend to bunch up.
An ensemble approach that combines both detection and density estimation is the option built for mixed-density environments, a platform that swings from empty to packed depending on the time of day. It switches between methods based on detected density, giving you the strengths of both. The cost is added engineering complexity, since now you're maintaining two models and the logic to switch between them.
Regression-based crowd-counting baselines treat the counting problem as a direct image-to-count regression, often via the density-map integration approach described above, trained end-to-end on annotated crowd images. Detection-plus-tracking baselines combine a detector with a tracking algorithm to count individuals crossing a defined line or zone boundary (a doorway, a gate), which is the natural fit for boarding and alighting counts where the question is specifically "did this person cross this threshold" rather than "how many people are in this frame."
A single fixed approach struggles across the full range of conditions a real deployment encounters: a platform that is empty at 2 AM and packed at rush hour needs both detection-based precision at low density and density-estimation robustness at high density. An ensemble strategy runs a lightweight density estimator continuously to assess current crowd density, then switches the primary counting method (or blends both outputs) based on that assessment, getting the precision of detection-based counting where it is reliable and the robustness of density estimation where it is necessary.
High-resolution visual data helps distinguish people from objects in both approaches: a low-resolution or heavily compressed camera feed degrades head-detection precision and reduces the texture information a density model needs to discriminate crowd regions from background clutter (railings, signage, luggage).
VGG16 is a common backbone for crowd-density estimation models, used as the feature extraction front-end in influential architectures like CSRNet and many of their derivatives, valued for the strong, well-understood feature hierarchy it provides even though it predates more recent, more efficient backbone designs. More recent work combines VGG16 with newer backbones (EfficientNet variants, for instance) to improve robustness specifically under adverse conditions like fog and rain, where published research shows meaningfully lower error rates from the combined approach relative to VGG16 alone (Springer Nature, 2025).
Density-map regression models are commonly trained with a pixel-wise loss (MSE between the predicted and ground-truth density maps) combined with a count-level loss term that directly penalizes error in the integrated total count, since a model can achieve a low pixel-wise loss while still producing a count that is systematically biased. Geometry-adaptive Gaussian kernels are the standard technique for generating ground-truth density maps from point annotations, accounting for the fact that the apparent size of a person's head varies with distance from the camera due to perspective.
Training data should be augmented to expose the model to the full range of density conditions the deployment will encounter: synthetic crowd composition (combining crops from sparse images to simulate denser scenes), random cropping and scaling to vary the effective density per training sample, and perspective-aware augmentation that accounts for how the same physical crowd density produces different apparent densities depending on camera angle and distance.
MobileNetSSD is a common lightweight choice for detecting individuals in resource-constrained deployments where a full-scale detector is too costly to run at the required frame rate. DBSCAN (a density-based clustering algorithm) is frequently used downstream of point-based detections for identifying high-density clusters within a scene, useful for generating heatmap visualizations or flagging specific sub-regions of a platform that have crossed a local density threshold even when the overall scene average remains acceptable.
The ShanghaiTech dataset is the most widely used training and benchmark dataset for crowd-counting models, split into Part A (482 dense, internet-sourced images) and Part B (716 relatively sparse street-scene images), giving researchers and practitioners a standard reference point across both density regimes that a real transit deployment is likely to encounter.
ShanghaiTech remains the standard starting point, with 1,198 labeled images and over 330,000 annotated people across both parts, giving broad coverage of both dense and sparse crowd conditions. Beyond ShanghaiTech, datasets like UCF-QNRF and JHU-Crowd++ provide additional scale and scene diversity for teams that need broader pretraining coverage before fine-tuning on deployment-specific data.
Crowd-counting datasets are typically annotated with a single point per head (a dot annotation), rather than a full bounding box, since precise box boundaries are both harder to annotate consistently in dense crowds and unnecessary for the density-map generation process, which converts point annotations into smooth Gaussian density maps automatically.
Genuinely extreme crowd densities, the kind that occur during a service disruption or a special event, are rare in routine operational footage but are exactly the conditions where a deployed system most needs to perform reliably. Synthetic data generation (compositing real crowd images at higher effective density, or using simulation tools that generate synthetic crowd scenes with controllable density) supplements naturally rare extreme-density training examples without waiting for the real event to occur and be captured.
High-resolution visual data helps distinguish people from objects in automatic passenger counting specifically because low-resolution input collapses exactly the fine detail (head shape, partial occlusion boundaries) that separates a person from a bag, a pole, or a shadow in the model's learned feature representation.
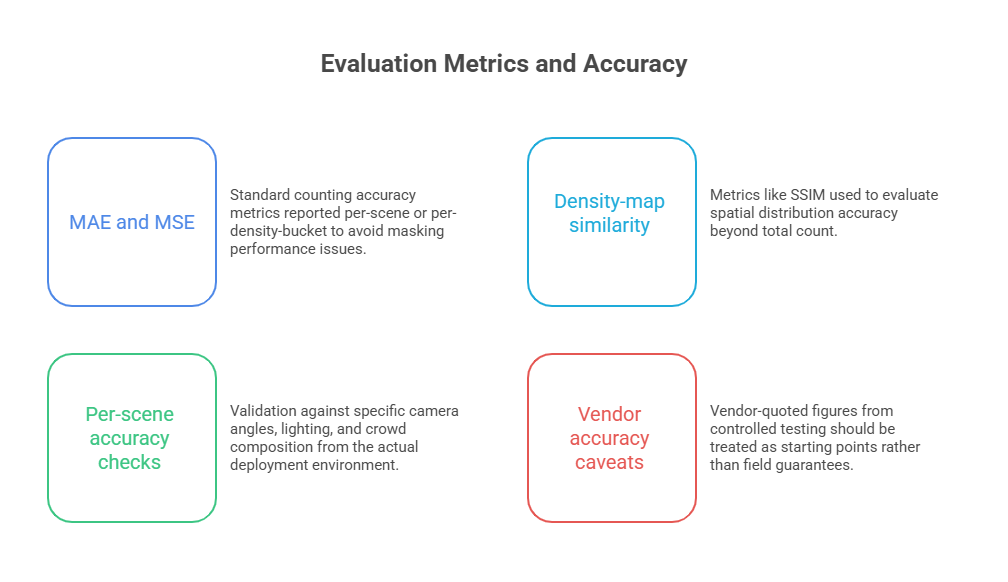
Mean Absolute Error (the average absolute difference between predicted and true count, across a test set) and Mean Squared Error (which penalizes large errors more heavily than small ones) are the standard counting accuracy metrics reported in the crowd-counting research literature. Both should be reported per-scene or per-density-bucket rather than as a single aggregate figure, since aggregate MAE can mask the fact that a model performs acceptably at low density and poorly at high density, exactly the failure mode that matters most for safety-relevant overcrowding detection.
Beyond the scalar count error, comparing the predicted density map directly against the ground-truth map (using metrics like SSIM, structural similarity) gives additional insight into whether the model is getting the spatial distribution of the crowd right, not just the total count, which matters for heatmap-based applications where the question is not just "how many people" but "where in the scene is the crowd concentrated."
A model validated only on a public benchmark dataset has not been validated on the specific camera angles, lighting, and crowd composition of the actual deployment. Per-vehicle or per-camera accuracy checks, run against a manually counted reference sample from the actual deployment environment, are the only way to know whether the published benchmark accuracy will hold in production.
AI-enhanced passenger counting can achieve over 98% accuracy under controlled conditions, a figure widely cited by APC system vendors based on testing typically conducted in a depot or laboratory setting. Independent field comparison studies tell a more complicated story: a peer-reviewed evaluation of a commercial APC system claimed by its manufacturer to be highly accurate at 98% found field accuracy of only 53–55% for boarding and alighting counts under real-world operating conditions, while a lower-cost system built specifically for the comparison achieved 72–75% in the same conditions (PMC, 2023). The gap is attributable to exactly the factors this guide covers: camera angle, passenger-flow density, and lighting conditions all degrade real-world accuracy relative to controlled test conditions, and accuracy can decline rapidly when any of these factors departs from the ideal. Any accuracy figure quoted by a vendor should be treated as a starting point for field validation, not a guarantee, and procurement decisions should weight field-validated, deployment-specific accuracy figures far more heavily than spec-sheet numbers from controlled testing.
For boarding and alighting counts tied to door-open events, the counting pipeline should complete within the door-open dwell window, typically a few seconds, to avoid missing fast-moving passengers at a busy stop. For continuous occupancy and density monitoring, a sustained update rate of 1–5 Hz is generally sufficient, since crowd density does not change as fast as the frame-by-frame dynamics relevant to safety-critical object detection.
Density estimation and detection models should be quantized (typically to INT8) for deployment to embedded hardware, reducing both inference latency and memory footprint with minimal accuracy loss when calibration is performed against representative crowd density data. See model quantization for edge deployment for the detailed mechanics.
Overhead or steeply angled mounting positions minimize self-occlusion (one person's head blocking another's) relative to a low, head-on camera angle, and are strongly preferred for both detection-based and density-based counting wherever physically feasible. Doorway-mounted cameras for boarding and alighting counts should be positioned to give a clear, minimally occluded view of the threshold passengers must cross. Wide-angle and fisheye cameras, often used to maximize coverage from a single device in a cabin or platform, need distortion handling before counting models can process the footage reliably; see fisheye dewarping for computer vision for the correction pipeline.
Onboard counting must continue functioning during tunnel sections, depot dead zones, or any other period of lost connectivity, since these are often exactly when a route operates and exactly when continuous count data still matters for the operational record. Local buffering of counts with periodic sync to the back-end when connectivity resumes is the standard architectural pattern, ensuring no count data is lost to a temporary network gap.
APC systems can use edge computing for instant data processing, and AI video analytics can process data locally for privacy, two benefits that point to the same underlying architectural choice: running the counting model on-device rather than streaming video to a remote server for analysis. See edge AI vs cloud AI for the full decision framework on when on-device processing is the right call.
Benchmark figures from a development GPU do not transfer directly to embedded deployment hardware. Profile the actual model, on the actual target device, under the actual expected camera resolution and frame rate, before committing to a production architecture.
Frame capture, resizing, and any preprocessing (dewarping, normalization) can become the bottleneck even when the model itself runs fast enough, particularly on embedded platforms where the ISP and CPU are shared resources. Profile the full pipeline end-to-end, not just the model's forward pass in isolation.
Where quantization alone does not bring a model within the required latency budget, pruning (removing low-contribution weights) or knowledge distillation (training a smaller model to replicate a larger model's outputs) can recover additional throughput, typically at a modest, measurable accuracy cost that should be validated against the deployment's actual accuracy requirement rather than assumed to be negligible.
Every optimization decision should be validated with a before-and-after measurement on the target hardware: latency, throughput, and accuracy on a held-out validation set, so that the trade-off being made is explicit and reversible if it proves unacceptable in practice.
Where raw video must be retained at all (for audit or model retraining purposes), face-blurring or similar anonymization should be applied before storage, particularly for any footage that might be reviewed by personnel beyond the immediate operational team. Where the counting application does not require retaining raw video at all, the strongest privacy posture is simply not storing it: process the frame, extract the count, discard the frame.
Document explicit retention periods for any video or count data that is stored, with automatic deletion enforced rather than relying on manual cleanup, and ensure the retention period matches the actual operational or regulatory need rather than defaulting to indefinite storage out of convenience.
A Data Protection Impact Assessment is a standard requirement under GDPR for systematic monitoring of public spaces, and passenger counting in transit or retail settings typically qualifies. Document the legal basis for processing, the specific data minimization measures in place (such as on-device processing and immediate frame discard), and the safeguards against function creep (the system being repurposed for individual tracking or identification beyond its stated counting purpose).
Counting on the edge means raw video need not leave the vehicle: if the count or density estimate is computed locally and only the resulting numeric data is transmitted, the system never creates a network-accessible stream of identifiable passenger video, which is the single most effective architectural choice for minimizing the privacy footprint of a passenger counting deployment. AI video analytics can process data locally for privacy precisely because the computation that would otherwise require transmitting raw video to a remote server happens instead on the device where the video originates. The same local-processing argument applies to anomaly detection for rare safety events, where onboard video can be analyzed without streaming it off the vehicle.
Specific GDPR and DPIA requirements vary by jurisdiction and by the precise nature of the deployment; verify current applicable requirements with legal counsel before finalizing a deployment architecture, particularly regarding any data that could plausibly be linked back to an identifiable individual.
A standardized ingestion layer (commonly RTSP for live video, or a direct edge-device API for already-processed counts) decouples the camera and edge-compute layer from downstream consumers, allowing new camera hardware or new edge compute platforms to be swapped in without requiring changes to every system that consumes the resulting data.
A REST or webhook-based API exposing current occupancy, recent boarding/alighting events, and density metrics lets dispatch systems, passenger information displays, and analytics dashboards all consume the same underlying count data without each needing direct access to the camera infrastructure itself.
A structured event format, typically including vehicle or location ID, timestamp, event type (boarding or alighting), and count delta, gives downstream systems a consistent, queryable record of occupancy changes over time, supporting both real-time dispatch decisions and historical schedule-optimization analysis from the same event stream.
Passenger counting systems can monitor boarding and alighting numbers continuously across an entire route or service day, and real-time vehicle occupancy data is provided by AI systems directly to the operational systems that need it (dispatch, passenger information, safety monitoring) without requiring manual aggregation or end-of-day reconciliation.
Build a representative test suite covering the full range of conditions the deployment will encounter: empty vehicle, light boarding, heavy rush-hour crowding, night operation, and any known difficult cases (a doorway with awkward sightlines, a platform with unusual lighting) specific to the deployment.
Before trusting a deployed system's output, run a parallel manual count over a representative sample period and compare directly against the system's output, computing accuracy specifically under the real operating conditions rather than relying on vendor-reported figures from a different environment.
Every identified discrepancy between the system's count and the manual reference count is a valuable training example. A systematic process for capturing these error cases, with the corresponding video clip and correct count, builds the dataset needed for targeted retraining that improves accuracy specifically on the failure modes the deployment actually encounters.
InTechHouse's experience validating counts in real, crowded transit conditions, developed for a European public transport vehicle manufacturer, anchors this validation methodology: lab-validated accuracy figures are a starting point, not a deliverable, and the only number that matters operationally is accuracy measured against manual counts in the actual deployment environment.
InTechHouse developed crowd analytics for a public transport operator's onboard system, for a vehicle environment where occupancy regularly reached densities at which individual passengers could not be reliably separated by a standard head-detection approach in the camera's field of view.
The deployed solution switched to density estimation and crowd-density heatmaps specifically for the high-occupancy condition, while retaining detection-based counting for lower-density periods of the service day, an ensemble approach matched to the actual operating density distribution of the route rather than a single fixed method.
Validated against manual reference counts collected directly in the deployment environment, the system's accuracy held within the operator's required tolerance across both the sparse and dense occupancy regimes, including during peak crowding when occlusion was most severe. The resulting density signal fed directly into the operator's overcrowding alert threshold, giving staff an early, quantified warning of approaching capacity rather than relying on subjective visual assessment.
Confirm target hardware availability and specification, required camera infrastructure (existing or new), network connectivity profile for the deployment route or site, and the model runtime and inference framework version compatible with the target accelerator.
Deploy the full pipeline (camera ingestion through count output) to a staging environment that mirrors production hardware as closely as possible. Run smoke tests covering basic functionality: does the pipeline start cleanly, does it produce output at the expected rate, does it recover correctly from a simulated connectivity interruption.
Validate against the agreed service-level commitments (accuracy under representative conditions, latency, uptime) using the methodology described in the Demo, Testing, and Validation section above, before promoting from staging to live production deployment.
Set a recurring schedule (monthly is a reasonable default for most deployments) to re-evaluate accuracy against fresh manual reference counts, since seasonal lighting changes, infrastructure modifications, or shifts in typical crowd composition can degrade a previously validated model's real-world accuracy over time without any change to the model itself.
Read also:
Occlusion remains the dominant failure mode at high density even for density-estimation approaches, which degrade gracefully rather than failing cleanly, meaning error increases progressively as density rises rather than there being a sharp, easily-detected failure threshold. Double-counting can occur at doorway thresholds when a tracking algorithm loses and reacquires an identity mid-crossing, particularly in crowded boarding scenarios where multiple people cross the threshold in close succession. Night and low-light conditions reduce the texture and contrast information both detection and density models rely on, requiring either supplementary illumination, infrared-capable cameras, or models specifically trained and validated on low-light footage rather than assuming daytime performance transfers directly.
Rather than passively waiting for errors to surface during routine operation, an active learning approach specifically targets collection of the conditions where the model is least confident or most likely to be wrong, accelerating the accumulation of exactly the training data that will most improve real-world accuracy.
Camera-only counting can be supplemented with additional sensor modalities for improved robustness. LiDAR uses laser pulses to scan and map objects, providing precise distance and point-cloud data that can help disambiguate overlapping figures that a 2D camera view cannot separate. Infrared time-of-flight sensors emit light pulses to build a 3D image of passengers, offering a complementary depth signal, particularly useful at doorway thresholds where precise individual counting matters more than the broader scene-level density estimate that camera-based approaches handle well.
RGB cameras remain the default choice for most crowd counting setups, and for good reason. They deliver rich visual detail at low cost using hardware that's already widely deployed across most transit systems. The 2D projection is the catch: depth information gets flattened out of the image entirely, so once bodies start overlapping in a crowd, the camera has no way to tell where one person ends and another begins. This makes RGB a solid fit for general counting and density estimation work, but a poor one wherever heavy occlusion is the norm rather than the exception.
LiDAR solves the exact problem RGB struggles with. Precise depth measurement lets it disambiguate overlapping figures that a camera would merge into a single blob. That precision comes at a real cost, both in hardware price and in resolution: LiDAR point clouds don't carry the fine-grained detail a camera does, so classification tasks that need visual texture aren't LiDAR's strength. Where it earns its keep is doorway and threshold counting, and dense scenes where separating individuals matters more than describing them.
Infrared time-of-flight sensors sit in between. They deliver 3D depth data at a lower cost than LiDAR, and unlike a standard camera, they keep working in the dark. The tradeoff shows up in range and resolution: ToF sensors cover less distance and produce a coarser image than a camera. That combination makes them a practical choice for low-light counting or doorway-specific deployments where LiDAR's cost isn't justified.
Camera and depth fusion pulls both approaches together, using the camera for visual classification and depth sensing to resolve the ambiguity that occlusion creates. This gets you the highest accuracy of the four options, but it also carries the most engineering overhead, calibrating two sensor modalities to work together isn't trivial. It's the right call specifically where accuracy requirements are strict enough to justify that complexity, safety-critical threshold counting being the clearest example.
The CrowdCountingBaseline and similar open-source repositories provide reference implementations for common density-estimation architectures (CSRNet, MCNN-style multi-column networks) useful as a starting point or accuracy baseline for a new deployment. Standard plotting and visualization libraries (Matplotlib, OpenCV's drawing functions) are sufficient for generating density-map overlays and accuracy comparison charts during development and validation.
Hugging Face and the Ultralytics model hub host pretrained detection models suitable as a starting point for the detection-based counting approach. ShanghaiTech, UCF-QNRF, and JHU-Crowd++ are available through their respective academic project pages and are the standard reference datasets cited throughout the crowd-counting research community.
Key papers worth reading directly include the original CSRNet paper (dilated convolutions for congested scene recognition), the Switching CNN paper for the density-vs-detection switching concept covered earlier in this guide, and the independent field-accuracy comparison study (PMC, 2023) cited in the Evaluation Metrics section, which remains one of the more rigorous publicly available comparisons between vendor-claimed and field-measured APC accuracy.
This is a practical resource list rather than an exhaustive literature survey; teams scoping a new deployment should expect to validate any candidate architecture directly against their own deployment data before committing to it in production.
On-device inference, no raw video leaving the vehicle, and hardware chosen for the power and vibration reality of transit. Talk to our edge AI team about a pilot on one route.
See how we deploy on-vehicle counting systems
Not sure where to start? We work with companies at every stage, from early ideas to enterprise-level builds. A 30-minute call can save you months of guesswork.
Automatic passenger counting (APC) is the use of sensors, typically cameras processed with computer vision for public transport, to count people boarding, alighting, and present in a vehicle or transit space without requiring manual observation. Modern AI-based APC systems use object detection or crowd density estimation models running on edge hardware to produce real-time counts that feed scheduling, safety, and passenger information systems.
Accuracy varies significantly with deployment conditions. Vendor specifications often cite figures above 98%, but these are typically measured under controlled, low-occlusion conditions in a depot or lab. Independent field studies have found real-world accuracy for some commercial systems as low as 53–55% under genuine operating conditions with normal crowding, camera angle constraints, and variable lighting. The practical takeaway is that any accuracy figure should be validated against manual reference counts in the actual deployment environment rather than trusted from a spec sheet alone.
Crowd density estimation is a computer vision technique that predicts a continuous density map across an image, representing how many people are present per unit area at every point in the scene, rather than attempting to detect and count discrete individuals. The total count is obtained by integrating (summing) the density map. This approach is necessary in crowded scenes where individual people overlap so heavily in the camera's 2D view that no detector can reliably separate one head from the next.
The standard approach switches from detection-based counting to density estimation as occlusion increases: a detector that finds and counts individual heads works well in sparse, low-occlusion scenes, but a density-estimation model that predicts a continuous crowd density map and integrates it handles dense, heavily occluded scenes far more robustly, since it does not require successfully separating every individual. Many production systems use an ensemble approach, running both methods and switching or blending between them based on the currently detected density level.
Yes, and this is the standard deployment pattern for accurate, low-latency counting. An edge AI compute unit processes camera feeds from onboard cameras directly on the vehicle, producing real-time boarding, alighting, and occupancy counts without requiring a continuous cloud connection. This architecture also has a privacy advantage, since raw video need not leave the vehicle, only the resulting numeric count and density data needs to be transmitted to back-end systems.
Tomasz Andrysiak, DSc, PhD, is an Expert and a Professor at Bydgoszcz University of Science and Technology. He has more than 30 years of academic, research, R&D, and technology-implementation experience in artificial intelligence, computational intelligence, signal processing, anomaly detection, cybersecurity, and complex information systems.
His research focuses on machine-learning and computational-intelligence methods for analyzing signals, time series, network traffic, industrial data, and multimodal datasets. He specializes in anomaly and failure detection, predictive modeling, intelligent monitoring, critical-infrastructure security, smart metering, biomedical signal analysis, and the practical deployment of AI in industrial and public-sector systems.
Tomasz is the author or co-author of more than 75 scientific publications, including papers published in internationally recognized journals and conference proceedings indexed by Web of Science and Scopus. His research has covered network anomaly detection, cybersecurity of critical infrastructure, ECG signal analysis, machine learning, smart water networks, telecommunications, and intelligent industrial systems.
He has led and contributed to national and European R&D programs focused on cyber situational awareness, critical-infrastructure resilience, autonomous systems, Big Data, intelligent water management, blockchain-based transaction platforms, and industrial AI. He leads industrial-doctorate projects involving AI-based CMDB automation and machine-learning methods for knowledge discovery in Big Data.
Tomasz is an IEEE Senior Member and has served as an elected member of the Commission of Informatics and Automation of the Polish Academy of Sciences, Poznań Branch. He has participated in scientific committees and journal boards, supervised doctoral research, reviewed publications for international journals, and co-authored patents and patent applications related to signal detection and LoRa-based ECG monitoring. He writes about industrial AI, machine learning, anomaly detection, predictive analytics, cybersecurity, signal processing, time-series analysis, and intelligent infrastructure.
Tomasz Andrysiak's academic profiles:
https://orcid.org/0000-0001-8138-6619
https://ludzie.nauka.gov.pl/ln/profiles/fHOpojQ2lIF
https://link.springer.com/chapter/10.1007/978-3-642-32384-3_28
https://www.researchgate.net/profile/Tomasz-Andrysiak
https://scholar.google.com/citations?user=RHW7zx4AAAAJ&hl=pl
https://dblp.org/pid/41/6793.html
https://radon.nauka.gov.pl/dane/profil/6FFA1E51186802ECFFB49644209B5BE0EBD68C55
https://pbs.edu.pl/pl/pracownik/tomasz-andrysiak
https://www.youtube.com/watch?v=6e1GTqT5czM
From first prototype to production, our engineers can help you scope it, build it and get it certified.
This initial conversation is focused on understanding your product, technical challenges, and constraints.
No sales pitch - just a practical discussion with experienced engineers.
Share a few details about your product and context. We’ll review the information and suggest the most appropriate next step.