


Data analysis has evolved significantly in recent years, thanks to advancements in artificial intelligence (AI) and machine learning (ML) technologies. These AI-powered tools are transforming the way data analysts extract insights, make predictions, and optimize business strategies. In this article, we’ll explore the five best AI tools that data analysts can leverage to enhance their analytical capabilities and deliver more impactful results.
AI (Artificial Intelligence) is used in analytics to enhance and streamline the process of extracting insights, patterns, and knowledge from large and complex datasets. Here’s how AI is utilized in analytics:
These models are only as useful as the data volume they can absorb, which is why analyst teams meet such tools inside a wider data programme. Our overview of what big data analytics is explains the storage, processing and governance layers that every tool on this list depends on.
The relationship between AI (Artificial Intelligence) and data analysis is symbiotic and complementary.
AI is growing in each industry. Each industry needs data to grow. So, the circle is complete and we need to understand it.
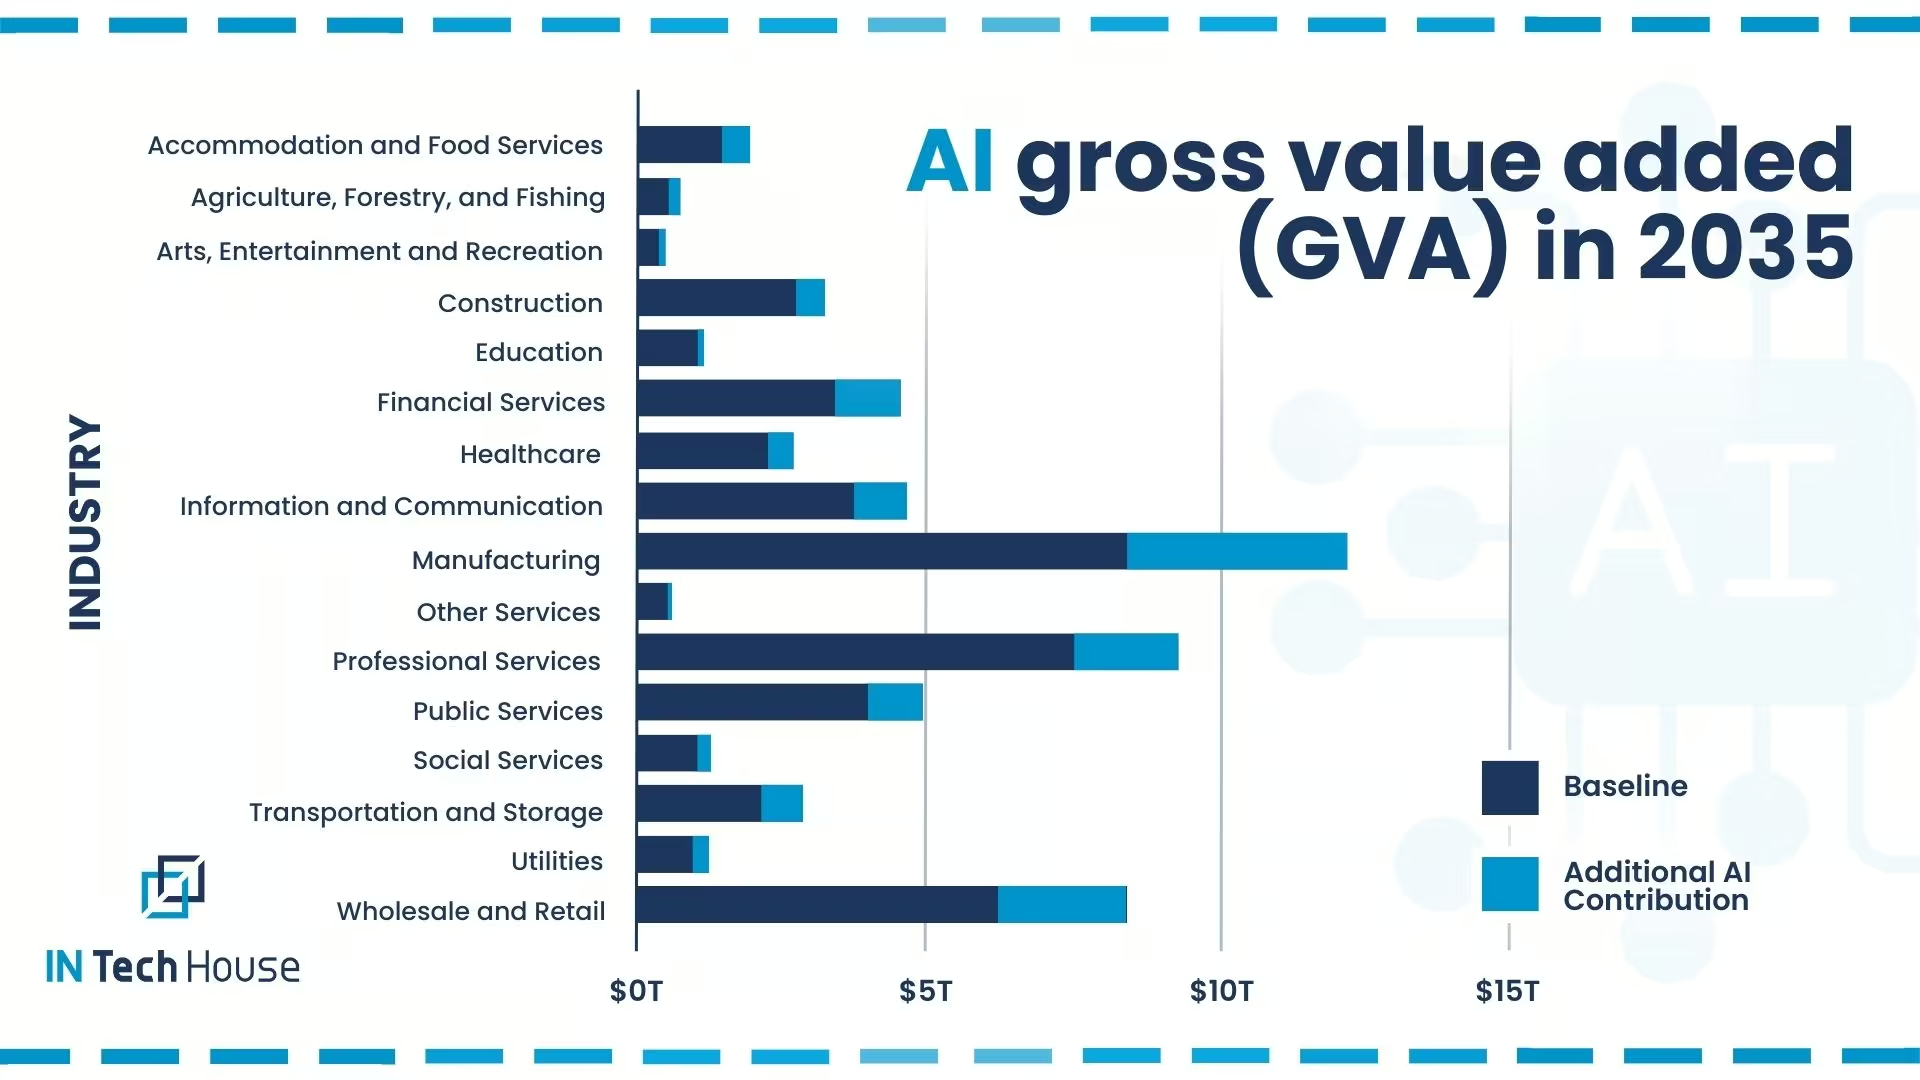
Source: Explodingtopics
AI enhances data analysis by providing advanced data analytics techniques and capabilities that help data analysts extract more meaningful insights from data.
Here’s how AI and data analysis are intertwined:
Data is the key to everything.
Believe it or not but
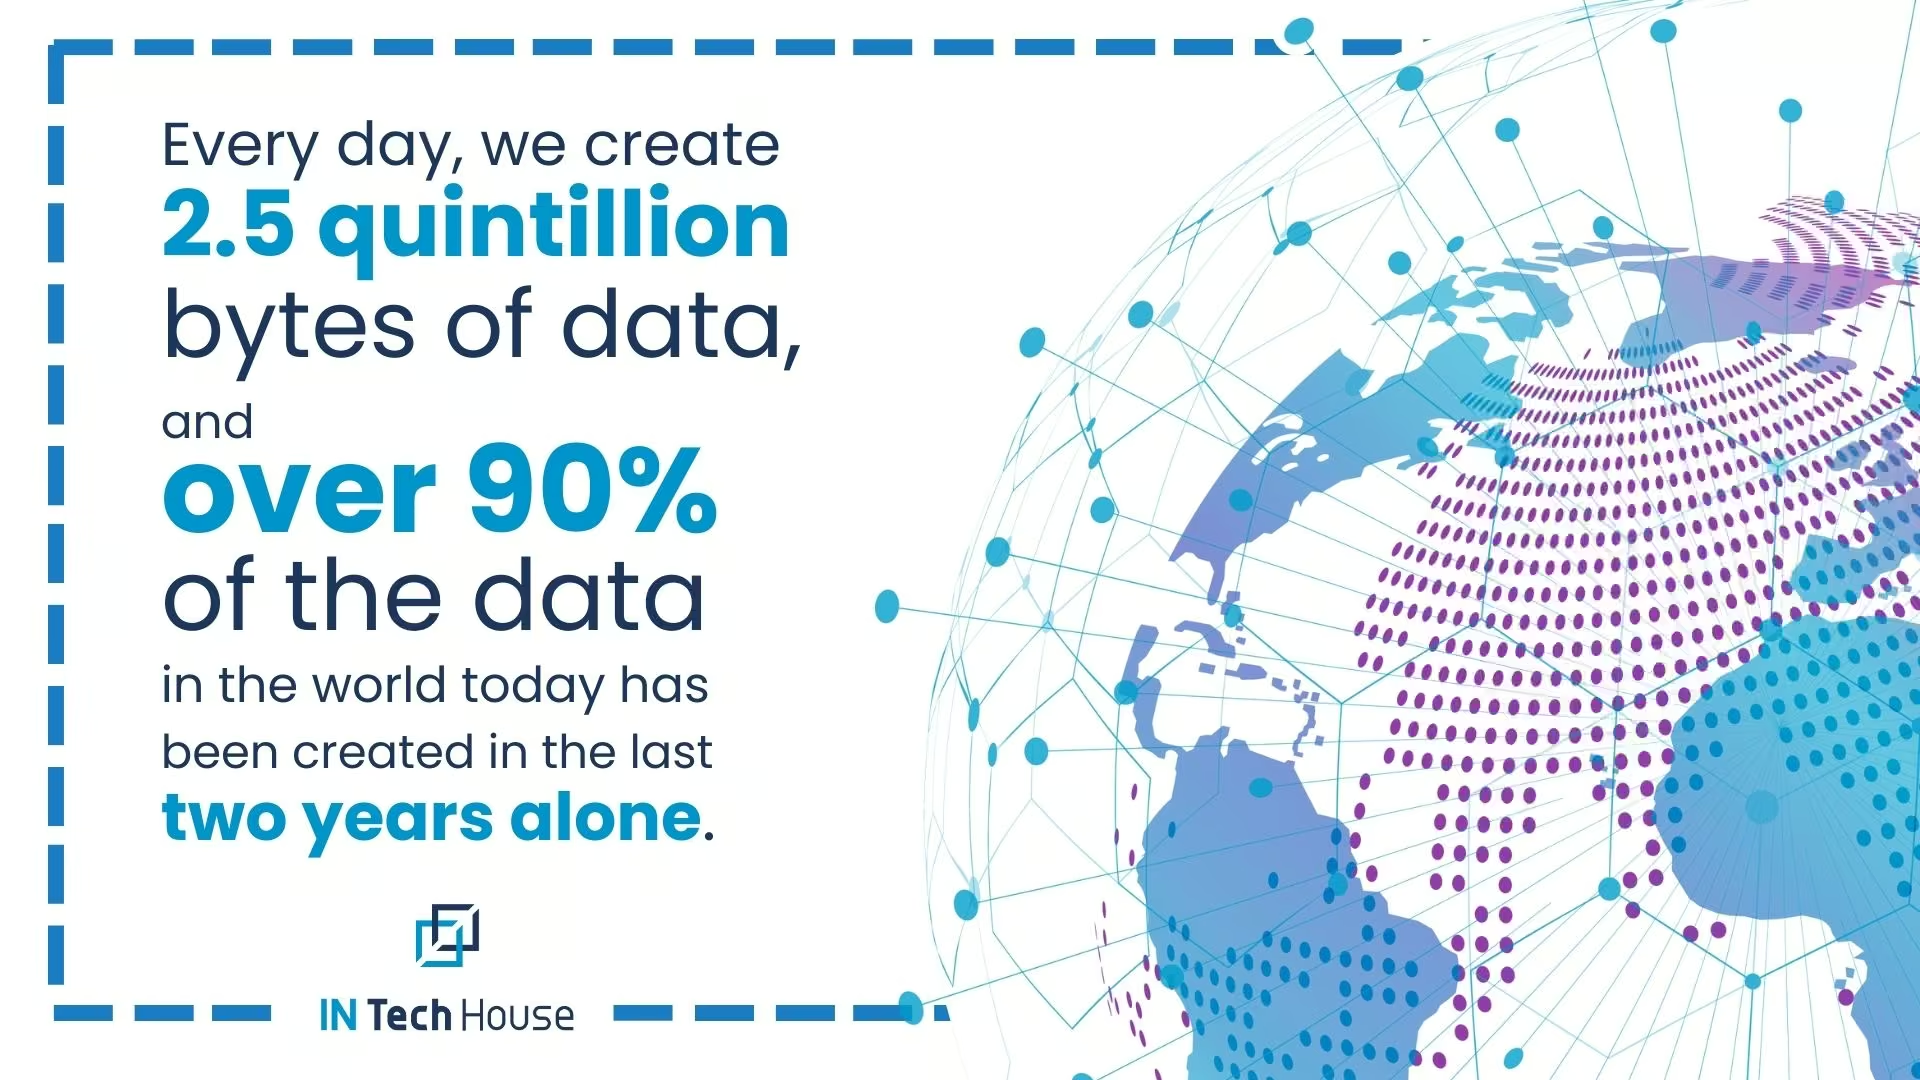
Source: Skeptics
Data analysis is of paramount importance in numerous domains and industries for several compelling reasons:
Data analysis is essential because it transforms raw data into actionable insights, facilitating better decision-making, problem-solving, and overall business success.
Data visualization is a powerful technique for representing data in visual formats such as charts, graphs, and dashboards. To use data visualization effectively, you’ll need the following:
Effective data visualization can make complex data accessible and understandable, enhancing decision-making and communication.
Off the shelf analytics tools rarely understand sensor, batch or line data. We build industrial AI models on your own signals so the output matches how the plant actually runs.
Move from generic AI tools to models that fit your process data
The specific data analysis process at INTechHouse may vary depending on the organization’s goals, projects, and data sources. However, a typical data analysis process involves several key steps:

The specific steps and tools used in the data analysis process at INTechHouse would be tailored to the organization’s projects and objectives. Data analysis is a dynamic and iterative process, with each step informing the next to ensure that valuable insights are derived from the data.
Data analysis methods encompass a wide range of techniques and approaches used to extract meaningful insights from data. Depending on the data and the objectives of the analysis, different methods may be employed. Here are 17 essential types of data analysis methods:
Descriptive statistics provide basic summaries of data, including measures of central tendency (mean, median, mode), dispersion (variance, standard deviation), and distribution (histograms, box plots).
Inferential statistics are used to make predictions or inferences about populations based on sample data. This includes hypothesis testing, confidence intervals, and regression analysis.
EDA involves visualizing and summarizing data to uncover patterns, relationships, and outliers. Techniques include scatter plots, histograms, and heat maps.
Time-series analysis is used for data collected over time, such as stock prices or temperature records. Methods include trend analysis, seasonality detection, and autocorrelation.
Regression models explore relationships between variables, with linear regression being one of the most common. It’s used for prediction and understanding the strength and direction of relationships.
Cluster analysis groups similar data points into clusters or segments based on similarities. It’s used in customer segmentation, image recognition, and more.
Factor analysis identifies underlying factors or latent variables that explain observed correlations in data. It’s often used in psychology and social sciences.
PCA reduces the dimensionality of data while retaining essential information. It’s useful for feature selection and data visualization.
Survival analysis models time-to-event data, such as the time until a failure occurs. It’s commonly used in medical research and reliability analysis.
Text analysis, including natural language processing (NLP), extracts insights from textual data. It’s used for sentiment analysis, topic modelling, and text classification.
Sentiment analysis assesses the sentiment or emotion expressed in text data, often for social media monitoring or customer feedback analysis.
Machine learning algorithms, including supervised and unsupervised learning, are used for various tasks such as classification, regression, clustering, and recommendation systems.
Anomaly detection identifies rare or unusual data points that deviate significantly from the norm. It’s critical in fraud detection, network security, and quality control.
Geospatial analysis focuses on data with geographic information, like maps and GPS coordinates. It’s used in urban planning, environmental science, and location-based services.
Network analysis studies relationships and interactions within networks, including social networks, transportation networks, and communication networks.
Simulation models use mathematical representations to simulate real-world processes. It’s applied in areas like finance, logistics, and epidemiology.
Deep learning, a subset of machine learning, employs neural networks with multiple layers for complex tasks like image recognition, speech recognition, and natural language understanding.

Read also:
Tableau is a powerful data visualization tool that integrates AI-driven features like Ask Data and Explain Data. It simplifies complex data analysis and helps users uncover insights through intuitive visualizations.
Microsoft’s Power BI is a popular business intelligence tool that leverages AI for quick insights, natural language queries, and advanced analytics. It’s user-friendly and well-suited for data analysis and visualization.
Python is a versatile programming language for data analysis and machine learning. Libraries like Pandas and Scikit-Learn offer a wide range of tools and algorithms for data manipulation, analysis, and modelling.
RapidMiner is an end-to-end data science platform that includes automated machine learning, data preparation, and predictive modelling. It’s suitable for both beginners and advanced data analysts.
DataRobot is an AI-driven automated machine learning platform. It streamlines the process of building and deploying machine learning models, making it accessible to data analysts and data scientists.
KNIME is an open-source data analytics platform that provides a visual interface for building data analysis workflows. It supports integration with various data sources and machine learning algorithms.
D3.js (Data-Driven Documents) is a JavaScript library for creating interactive data visualizations in web applications. It’s highly customizable and ideal for creating bespoke data visualizations.
Google Cloud AutoML simplifies the development of custom machine-learning models. It’s user-friendly and offers solutions for image classification, natural language processing, and more.
Jupyter Notebooks provide an interactive environment for data analysis and code sharing. It’s widely used by data analysts and scientists for documenting and executing code.
IBM Watson Studio is a comprehensive AI and data science platform that includes tools for data exploration, machine learning, and model deployment. It’s suitable for enterprise-level data analysis projects.These AI tools cover a broad spectrum of data analysis needs, from data preparation and exploration to advanced machine learning and visualization. The choice of tool depends on your specific requirements, preferences, and the nature of your data analysis projects.

Source: Quasa
Data cleaning is a crucial and unavoidable step in the data analysis process. Here are several reasons why you shouldn’t forget or neglect data cleaning:
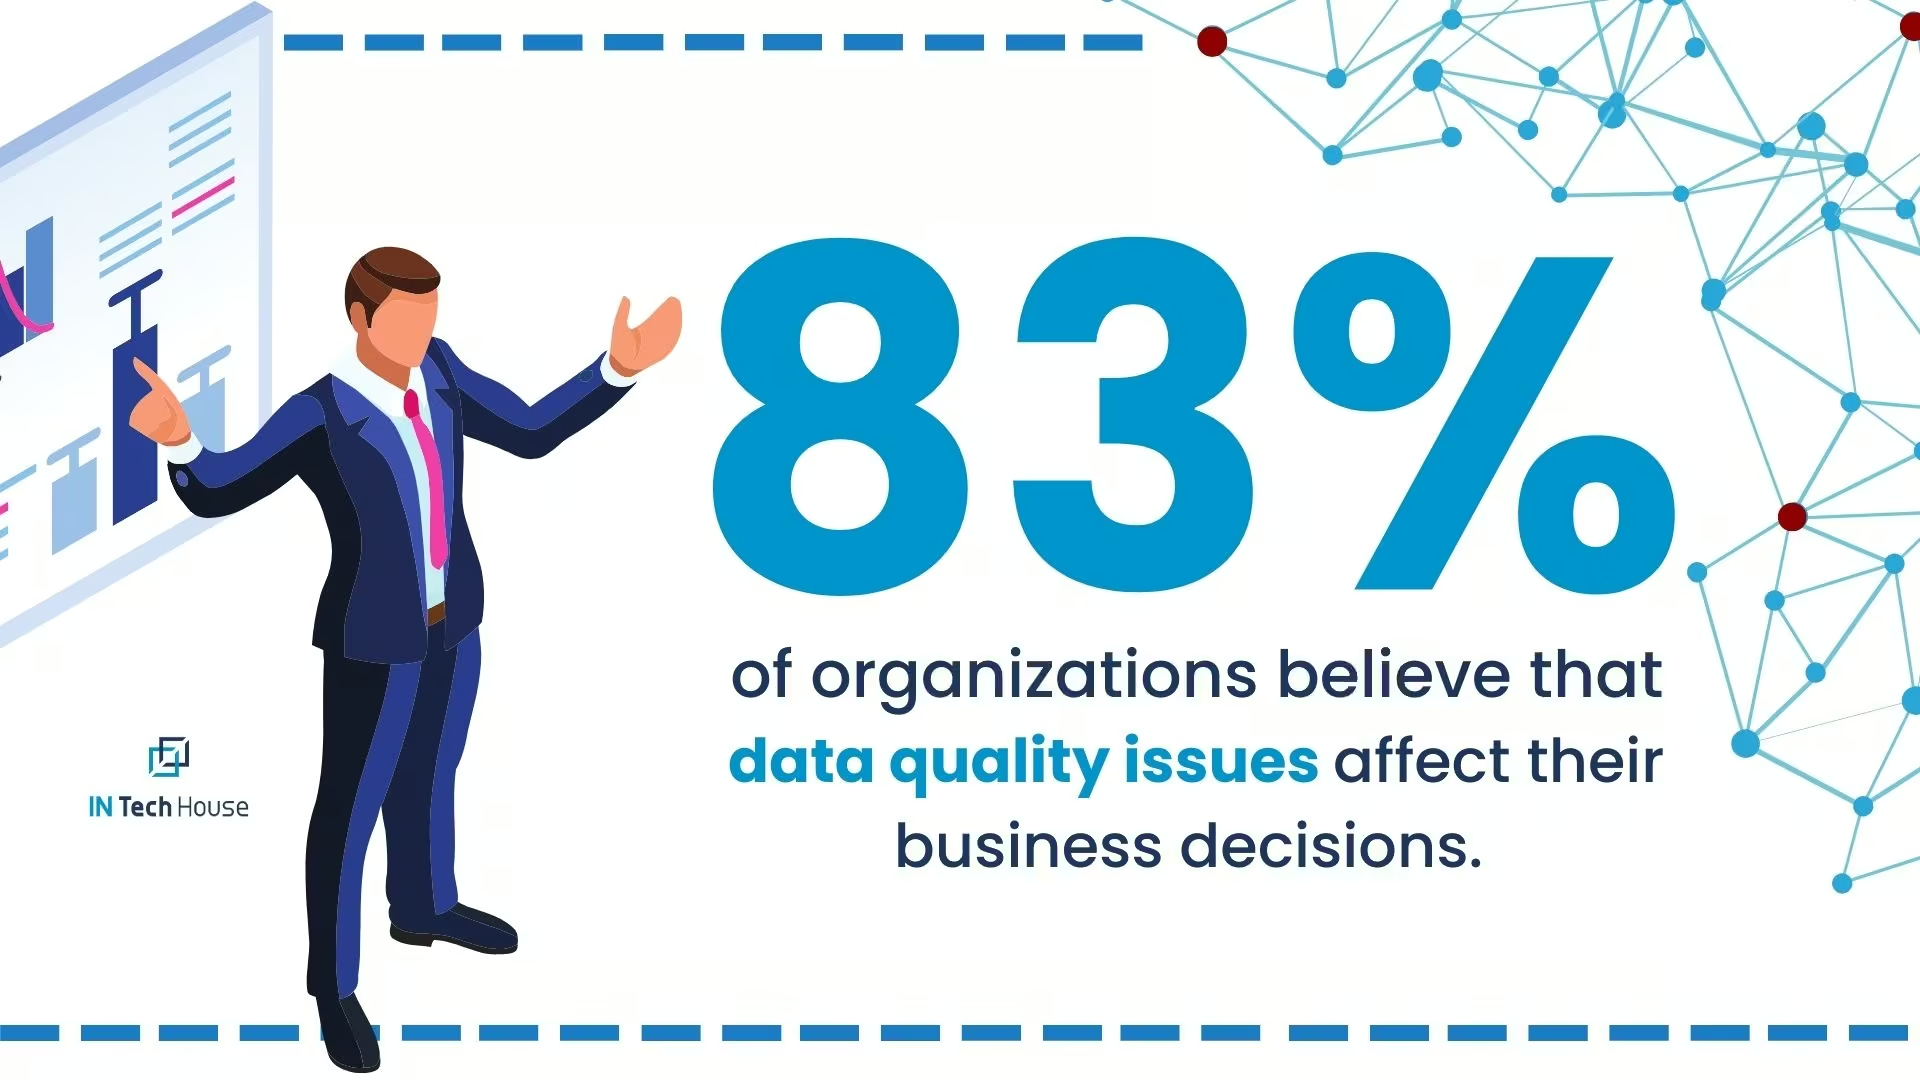
Source: Experian Data Quality
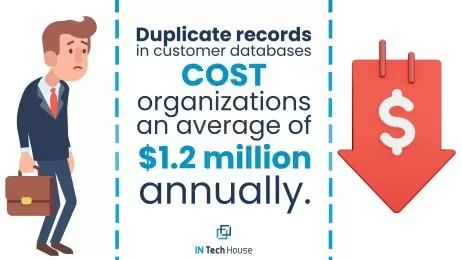
Source: Gartner
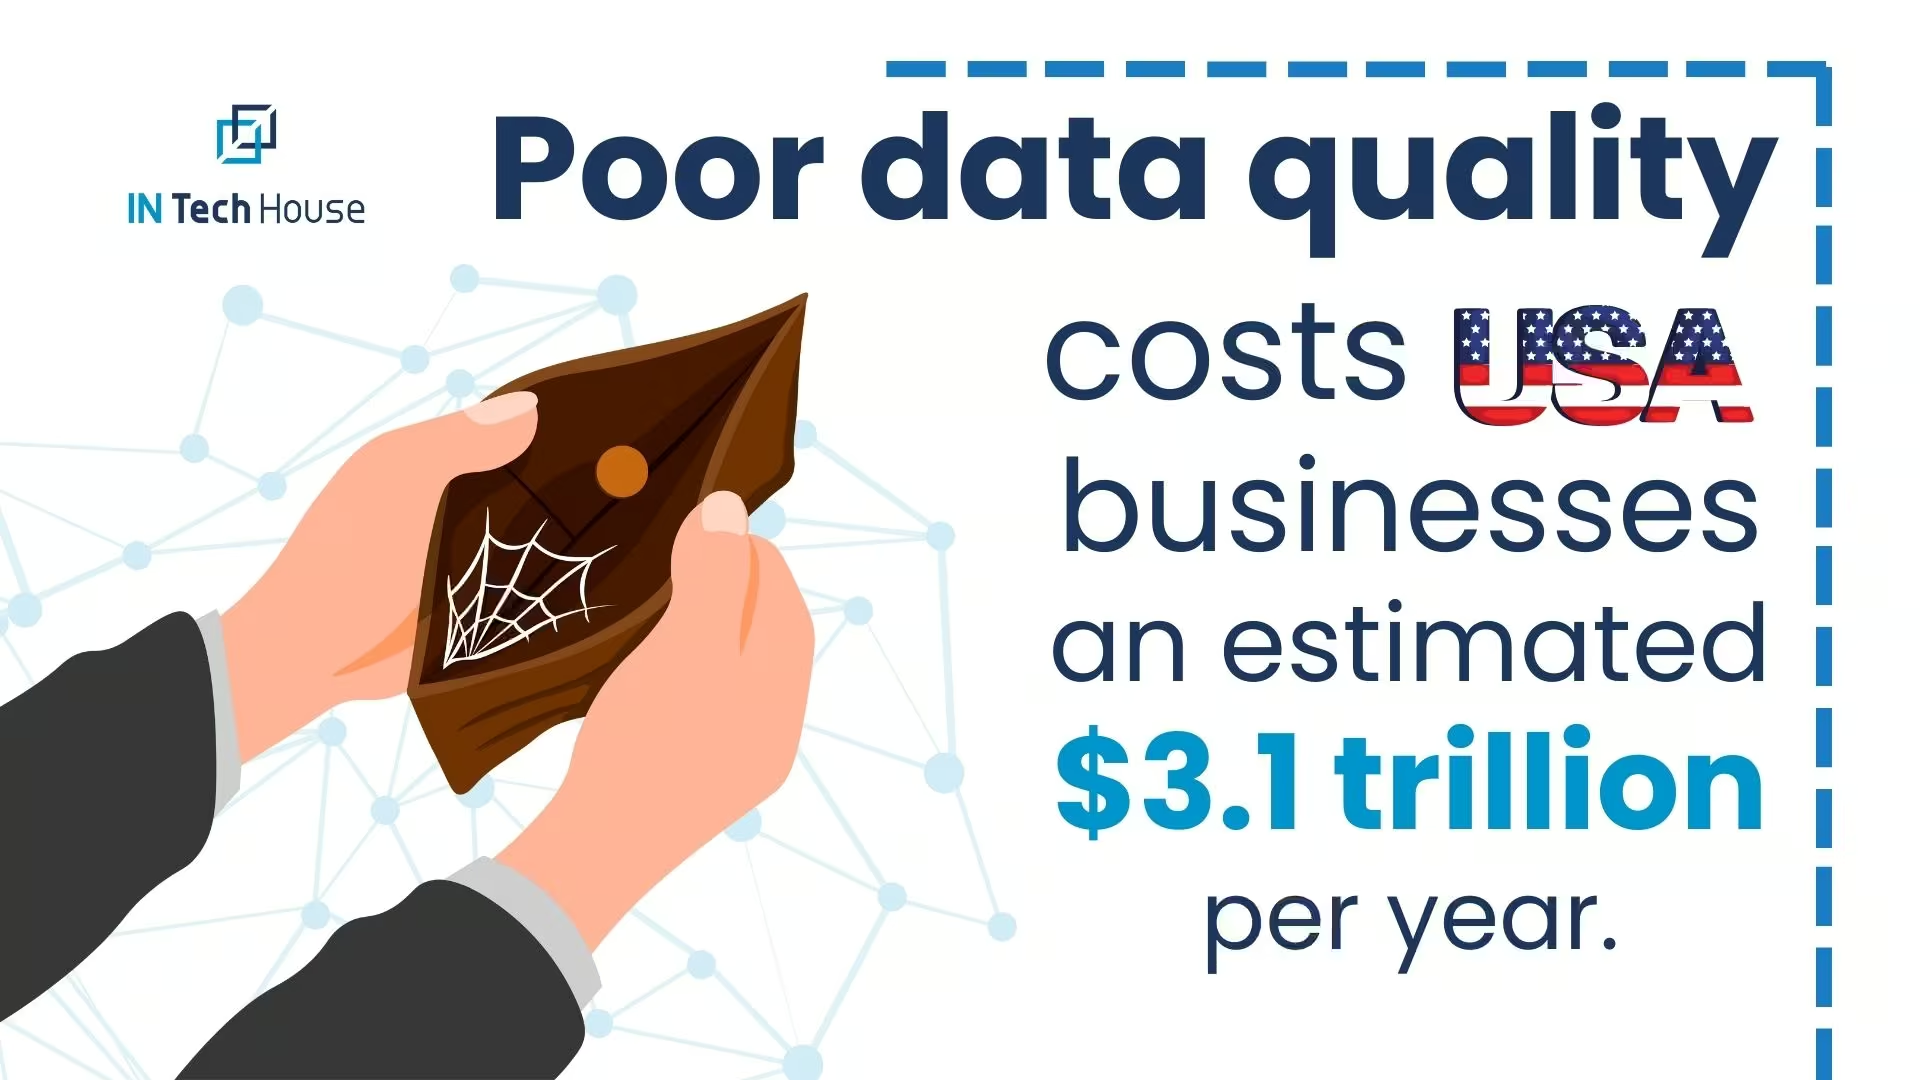
Source: Enterprenuer
Do you still believe that Data Doesn’t Matter?But modern experts think that Data is Everything and AI data analysis is important for cleaning and data preparation.
Building a data management roadmap with INTechHouse involves a systematic approach to address your organization’s data management needs and goals. Here’s a step-by-step guide to creating a comprehensive data management roadmap:
A tool demo is not a deployment. Our team handles data preparation, model validation and integration with your existing systems so the analysis survives contact with live operations.
See how we take an AI model from notebook to production
Not sure where to start? We work with companies at every stage, from early ideas to enterprise-level builds. A 30-minute call can save you months of guesswork.
Data analysis in research is crucial for several reasons:
Data analytics relies on various analytical tools, including:
The field of data analytics offers excellent career prospects:
Data analysis in Excel involves using Microsoft Excel's built-in features and functions to manipulate, summarize, and visualize data. It includes tasks like:
Jacek Suty is Head of Solution Architecture at InTechHouse, with more than 30 years of experience in system architecture, enterprise IT, infrastructure, information security, and complex digital transformation programs.
He specializes in designing enterprise and solution architectures, translating business and regulatory requirements into scalable technology platforms, and coordinating delivery across software, infrastructure, data, and security teams. His work covers enterprise architecture based on TOGAF, system modeling using UML and BPMN, cloud and on-premise infrastructure, CI/CD processes, data platforms, cybersecurity, and IT governance.
Jacek has contributed to large-scale technology programs for public institutions, finance, energy, education, healthcare, utilities, and digital archives. His project experience includes nationwide public digital infrastructure, distributed document-management and archiving systems, data-exploration platforms using machine learning and predictive analytics, and transaction systems combining blockchain, metadata standards, and computational intelligence.
He holds PRINCE2 Practitioner, Management of Risk, Scrum Master, ITIL Foundation, and ISO/IEC 27001 Lead Auditor qualifications. Jacek is currently pursuing a doctoral degree at Bydgoszcz University of Science and Technology, combining academic research with extensive experience in real-world architecture and technology delivery.
He writes about enterprise architecture, system design, digital transformation, data platforms, cloud infrastructure, cybersecurity, technology governance, and the practical application of AI in complex information systems.
Jacek Suty's academic and professional profiles:
https://pbs.edu.pl/pl/doktorant/uczelniania-rada-samorzadu-doktorantow
https://www.isep.pw.edu.pl/isep/zs/Aktualnosci/Kalendarium-wydarzen2/Seminarium-zakladowe-9.03.2021-Jacek-Suty
https://aionehealth.pl/wp-content/uploads/2026/04/Raport-2026-final.pdf
This initial conversation is focused on understanding your product, technical challenges, and constraints.
No sales pitch - just a practical discussion with experienced engineers.
Share a few details about your product and context. We’ll review the information and suggest the most appropriate next step.